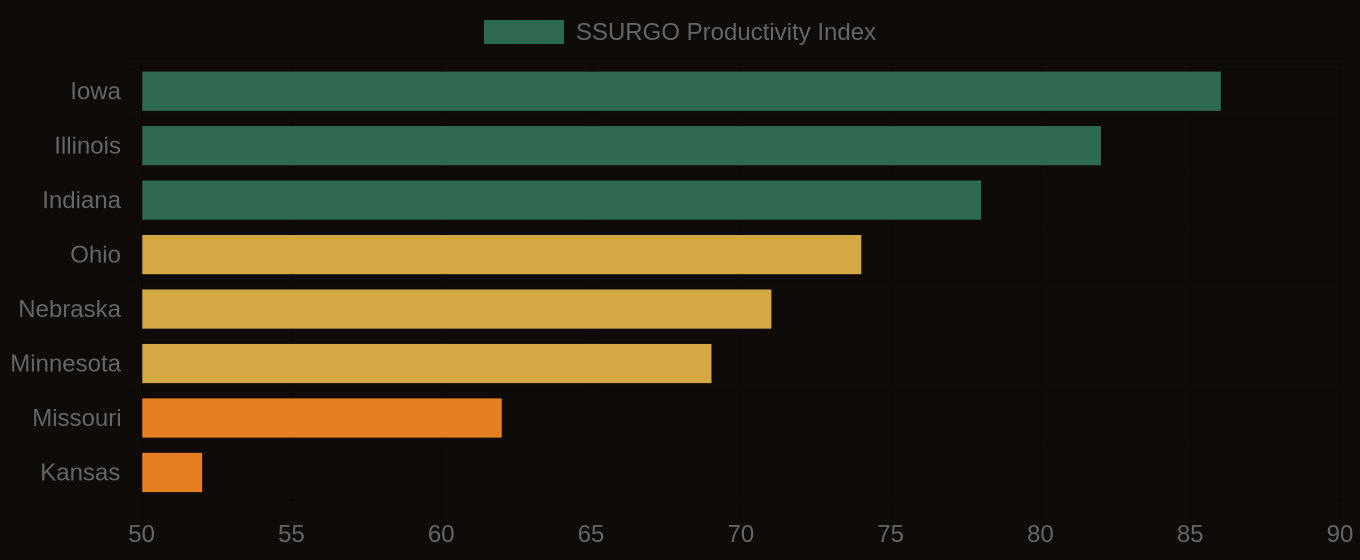
The value of agricultural land in the Corn Belt is increasingly decoupled from its underlying soil quality. For a decade, cash rents have climbed, often outpacing actual soil productivity. This divergence creates a hidden risk for farmland investors and agricultural lenders, now measurable at the county level.
Soil organic matter is central to productivity, holding water, binding soil particles, and releasing nutrients. Its depletion reduces water retention, increases erosion risk, and elevates fertilizer needs. While laboratory methods quantify organic carbon, the Kellogg Soil Survey Laboratory (KSSL) offers a vast spectral library, with over 50,000 Vis-NIR-SWIR scans matched to lab chemistry. KSSL spectral studies confirm that bare soil Vis-NIR-SWIR reflectance predicts soil organic carbon with R-squared values from 0.75 to 0.88 in the Corn Belt. This spectral relationship allows remote estimation of organic matter.
What SSURGO Reveals
Researchers use a bare soil composite from 20 years of Landsat imagery to capture stable spectral signals, correlating with organic matter at 30-meter resolution. For finer detail, multispectral drone imagery at 5-cm resolution predicts soil organic matter from bare soil composites with R-squared values of 0.82 to 0.87. Sentinel-1 SAR backscatter detects surface soil moisture at 10-meter resolution under all weather conditions, providing vital context for productivity. These combined methods reveal subtle but significant soil quality changes, often missed by short-term yield records.
This hidden degradation poses a direct underwriting hazard for agricultural lenders. A loan based on current cash rents for Drummer silty clay loam in Central Illinois, for example, might overlook years of organic matter depletion. Such decline means higher input costs, reduced drought resilience, and lower net returns, eroding collateral value and increasing default risk. For conservation buyers, these data pinpoint priority areas for restoration investment.
Soil Productivity Index vs. Cash Rent — Corn Belt States
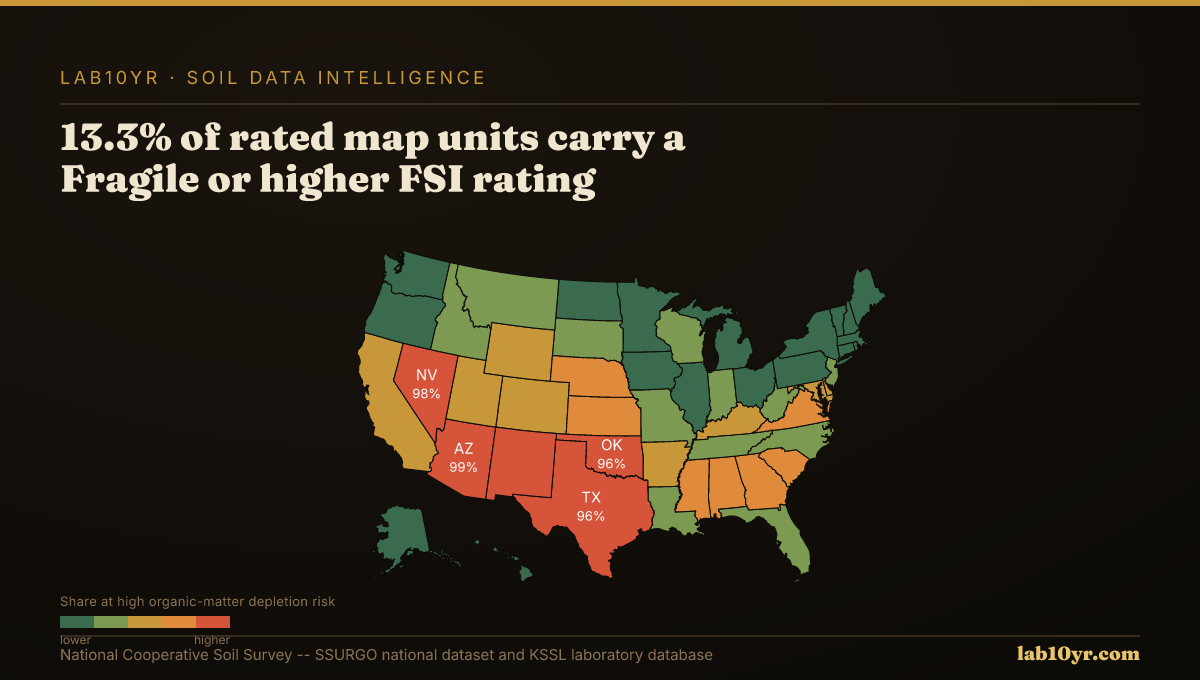
States at Greatest Risk
For data access, SSURGO provides organic matter estimates in the `component` table (`om_r` field) and horizon-specific ranges in `ch` (`om_l`, `om_h`). The `fragile_soil_index_class` in the `mapunit` table identifies degradation risk; 28,122 of 211,283 rated map units nationally are classified as Fragile or higher. Lab10YR analyzes these 315,543 map units in the SSURGO national dataset to provide thorough soil quality assessments.
Integrating scientific soil data into financial models is essential. Investors and lenders must understand organic matter and productivity trends to accurately price risk, identify true value, and ensure the long-term sustainability of their agricultural assets.
Soil Productivity Index — Farmland Investment Map