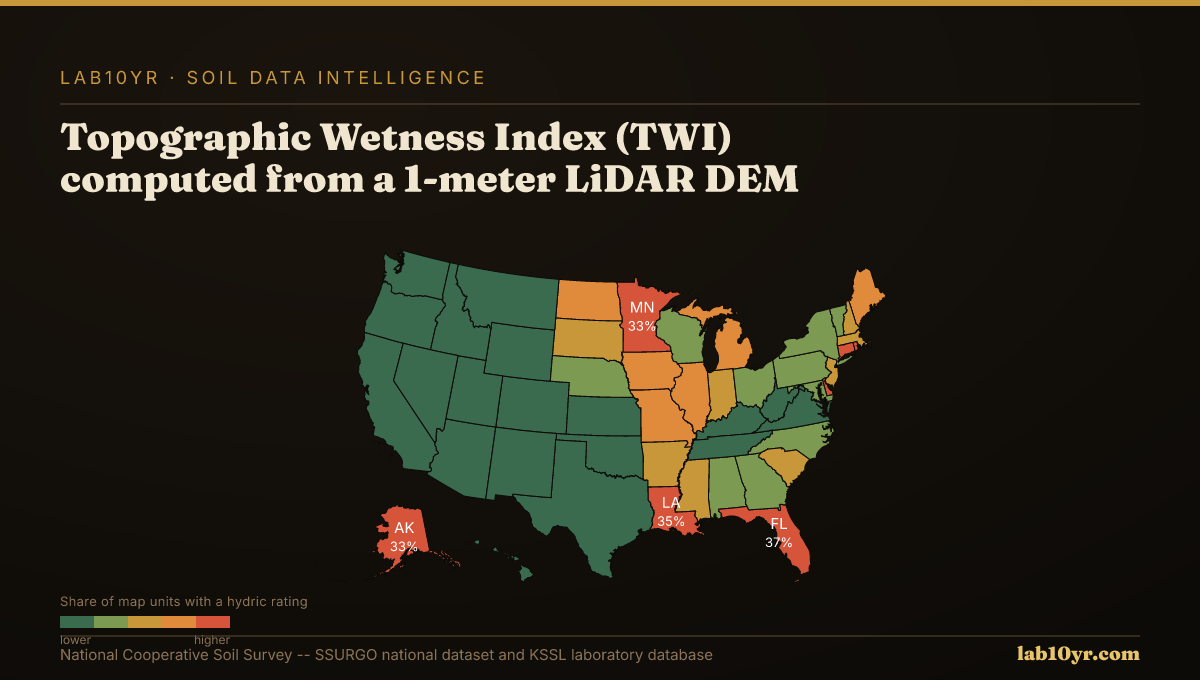
FEMA flood maps show where water goes, but soil drainage class reveals how fast it gets there and where it stays. This fundamental property from the National Cooperative Soil Survey's SSURGO database offers a critical, often overlooked, layer of flood risk assessment for insurance underwriters, FEMA analysts, and county assessors.
Soil drainage class describes the frequency and duration of wetness in the soil profile, from excessively drained to very poorly drained. This classification considers texture, structure, depth to restrictive layers, and the seasonal high water table. "Hydric soils" are a specific subset of very poorly drained soils, indicating conditions suitable for wetlands. These data are found in the drainagecl field of the component table within SSURGO.
What SSURGO Reveals
Along the Gulf Coast, extensive Barataria series soils are very poorly drained, elevating flood damage potential beyond FEMA zones. Conversely, well-drained Saugatuck series in Michigan's higher elevations promote rapid infiltration, mitigating surface ponding.
A proposed development in eastern North Carolina on poorly drained soils might be under-insured if risk is based solely on FEMA maps. Persistent subsurface saturation, even from minor rainfall, could lead to tens of thousands in foundational damage, an oversight of inadequate flood insurance coverage.
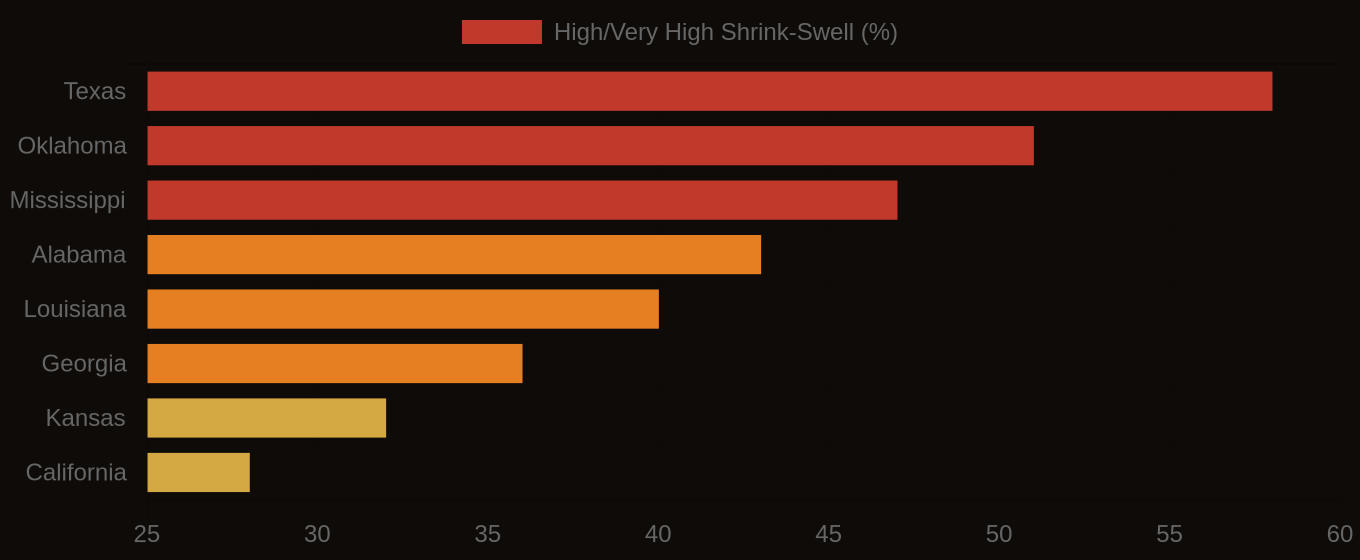
Shrink-Swell Soil Hazard — High & Very High COLE Class by State
| State / Region | High/Very High Shrink-Swell (%) |
|---|---|
| Texas | 58% |
| Oklahoma | 51% |
| Mississippi | 47% |
| Alabama | 43% |
| Louisiana | 40% |
| Georgia | 36% |
| Kansas | 32% |
| California | 28% |
| Missouri | 25% |
| Colorado | 22% |
Where Exposure Is Highest
In agricultural Iowa, very poorly drained soils like the Okoboji series retain standing water longer after floods, delaying planting and causing significant crop losses. For agricultural lenders, incorporating this drainage data into loan underwriting prevents inaccurate collateral valuation and potential defaults from prolonged inundation.
Soil drainage class, traditionally field-derived, is now highly predictable using geospatial analysis. The Topographic Wetness Index (TWI) from 1-meter LiDAR Digital Elevation Models quantifies water accumulation potential, outperforming simpler predictors. We access these interpretations by querying the component table in SSURGO via Soil Data Access (SDA), specifically the drainagecl field, for large-scale assessment across 315,543 national map units.
Shrink-Swell Soil Hazard — Structural Damage Exposure
The Actuarial Gap
Integrating granular soil drainage class data moves beyond surface-level flood maps, enabling more precise risk assessment. This deeper understanding of subsurface water dynamics enables professionals to make more informed decisions, protecting investments and enhancing community resilience against increasing precipitation events.