Carbon verification bodies increasingly demand strong soil organic carbon baselines and verifiable monitoring. Our analysis shows that readily available soil spectral data from the Kellogg Soil Survey Laboratory (KSSL), combined with SSURGO mapping, can predict soil organic carbon with R-squared values up to 0.88 in key agricultural regions, providing much of the necessary measurement and verification data without extensive new fieldwork. This data-driven approach builds a foundation of credibility for carbon credit projects.
Soil organic matter, the primary reservoir of soil carbon, dictates a soil's capacity to sequester atmospheric CO2. The Kellogg Soil Survey Laboratory (KSSL) has built the largest publicly available soil spectral dataset globally, containing over 50,000 samples scanned using Visible-Near-Infrared-Shortwave Infrared (Vis-NIR-SWIR) spectroscopy, each matched with full laboratory chemistry measurements. This foundational work allows us to correlate spectral signatures from remote sensing with actual organic carbon content, establishing a key link between surface reflectance and subsurface reality.
The Regional Concentration
This KSSL library is the calibration bedrock for remote sensing models. Bare soil Vis-NIR-SWIR reflectance, for instance, predicts soil organic carbon with R-squared 0.75-0.88 in the Corn Belt when models are calibrated with geographically matched training samples. Multispectral drone imagery at 5-cm resolution predicts soil organic matter with R-squared 0.82-0.87 from bare soil composites, outperforming satellite imagery for intra-field OM mapping. Furthermore, a bare soil composite from 20 years of Landsat imagery captures stable soil spectral signals that correlate with OM at 30-meter resolution, enabling regional carbon mapping by removing transient effects like vegetation and clouds.
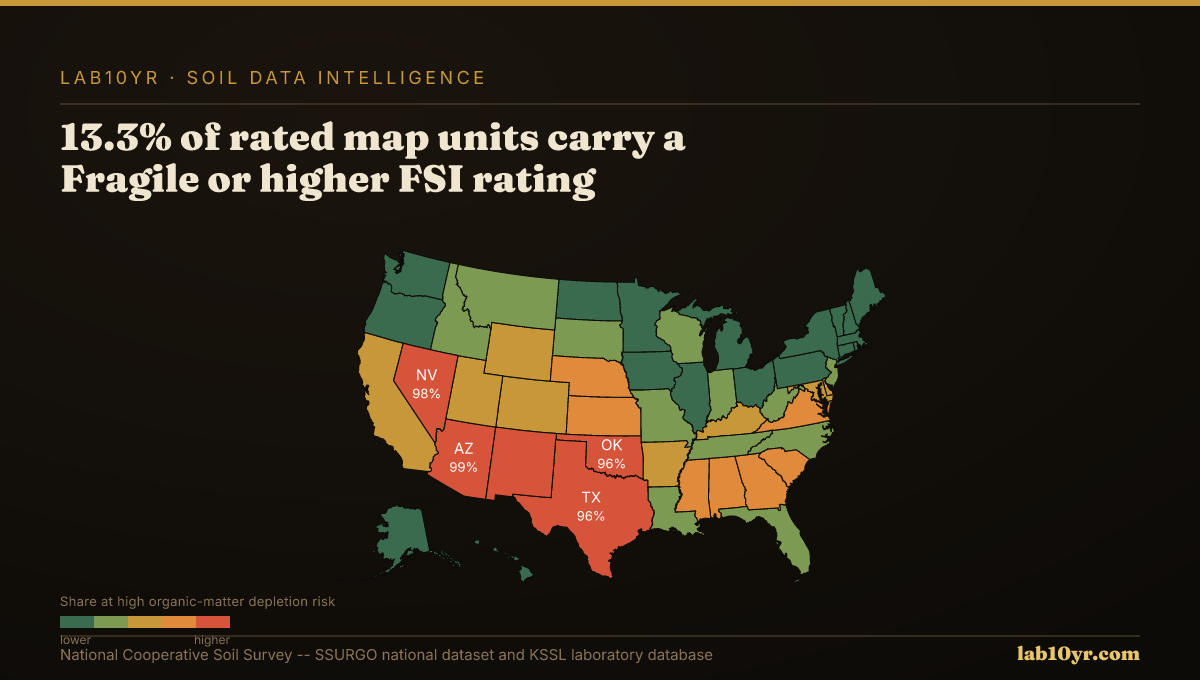
For carbon project developers and corporate sustainability teams, this means establishing credible baseline organic matter levels and monitoring changes over time, satisfying the rigorous measurement, reporting, and verification (MRV) requirements of bodies like Verra and Gold Standard. Soil Data Access, specifically the `coecocarb` and `chorsccarb` tables, provides mapped soil carbon data down to individual horizons within SSURGO's 315,543 map units. These data, interpreted alongside properties like the Fragile Soil Index where 13.3% of rated map units carry a Fragile or higher FSI rating, inform the long-term stability of sequestered carbon. Sentinel-1 SAR backscatter, detecting surface soil moisture at 10-meter resolution even under cloud cover and at night, further refines these models by accounting for moisture's influence on spectral readings and carbon cycling.
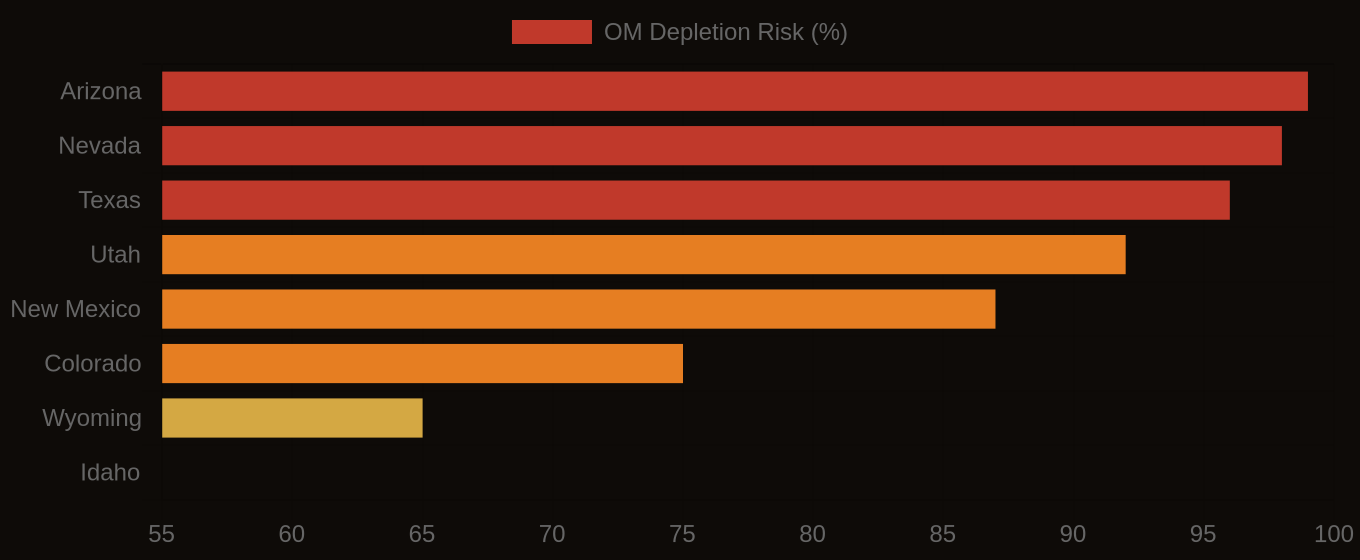
Organic Matter Depletion Risk by U.S. Region
| State / Region | Very High | High | Moderate | Low |
|---|---|---|---|---|
| Southwest | 72% | 20% | 6% | 2% |
| Great Plains | 48% | 32% | 14% | 6% |
| Southeast | 38% | 30% | 22% | 10% |
| Corn Belt | 22% | 28% | 32% | 18% |
| Mountain West | 61% | 22% | 12% | 5% |
| Pacific NW | 18% | 24% | 36% | 22% |
| Northeast | 12% | 20% | 40% | 28% |
The Valuation Gap
This integration of KSSL lab data, satellite imagery, and SSURGO soil properties provides an independent, scalable layer of verification, reducing the reliance on costly, sparse field sampling and accelerating project development.
Accurate soil carbon accounting underpins the integrity of the entire carbon credit market. Using existing, authoritative soil data enables stakeholders to build transparent, verifiable carbon projects, supporting trust and accelerating investment in regenerative agricultural practices.
Organic Matter Depletion Risk — State Overview