Convolutional neural networks trained on soil profile images now classify texture class from a single smartphone photo with about 78 percent accuracy. A convolutional neural network, or CNN, is a deep learning model that reads an image as overlapping patches and learns which visual patterns predict a label. For soil texture, the labels are the twelve classes of the texture triangle, from sand through silty clay, defined by the percentages of sand, silt, and clay in the fine-earth fraction. Those percentages are measured in the lab by pipette or hydrometer sedimentation, which times how fast particles of different sizes settle in suspension. The KSSL database holds roughly 60,000 laboratory-verified pedons, and that ground truth is exactly what a texture classifier needs to learn from.
The science is harder than it looks. A photo captures color, aggregate shape, and surface roughness, but not particle size directly. The model is learning a correlation: clays crack and form blocky peds, sands look granular and reflect light differently, silts feel and photograph smooth. Moisture and lighting shift those cues badly, which is why field accuracy lands near 78 percent rather than the high 90s a lab reports. Color alone cannot separate a silt loam from a loam, because both can share the same Munsell hue.
What the Data Shows
This is where the data layer earns its place. A photo gives a point estimate; SSURGO gives the spatial expectation. When a field classifier flags clay loam at a sample point, the matching SSURGO map unit tells you whether that fits the mapped series and horizon, or whether you have found an inclusion the survey generalized away.
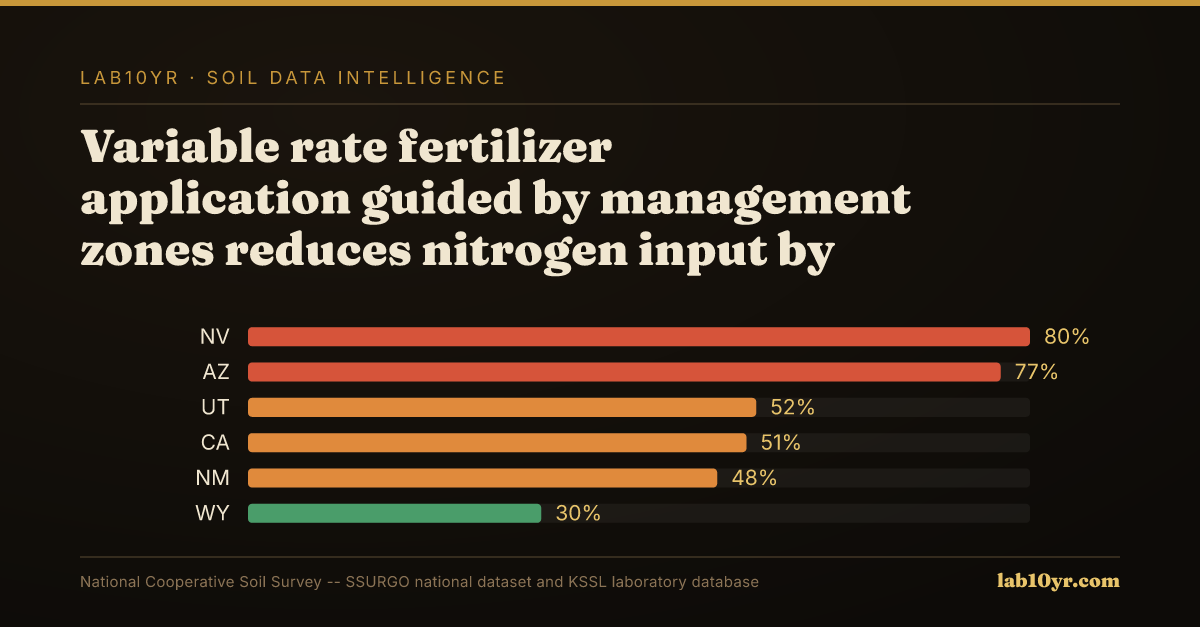
For a precision agriculture company, the payoff is a hybrid: cheap smartphone classification to densify a field, anchored by free SSURGO polygons and KSSL calibration. That cuts the $8 to $15 per acre cost of grid soil sampling while keeping the laboratory backbone. An agronomist confirming texture before a variable-rate prescription, or an environmental consultant verifying a wetland soil call, gains a defensible point check instead of a hunch.
Computer Vision Soil Classification - Accuracy by Method
| State / Region | Accuracy (%) |
|---|---|
| Random Forest + LiDAR + Spectral | 88% |
| CNN Soil Texture (field photo) | 78% |
| OBIA Boundary Detection | 76% |
| Transfer Learning (fine-tuned) | 74% |
| Sentinel-2 Time Series | 71% |
| Munsell Color (phone photo) | 82% |
The Regional Picture
Query texture by component and horizon through the chorizon table in the National Cooperative Soil Survey (SSURGO), and pull sand, silt, and clay percentages alongside the named texture class. At lab10yr.com we already surface those texture distributions per map unit so a field photo has something rigorous to be checked against.
Computer vision will keep closing the gap, but it will always be a classifier of appearance standing on a foundation of measured particle size. The model is only as honest as the pedons behind it, and the smartest workflow treats a photo as a fast hypothesis that SSURGO and KSSL data are there to confirm.
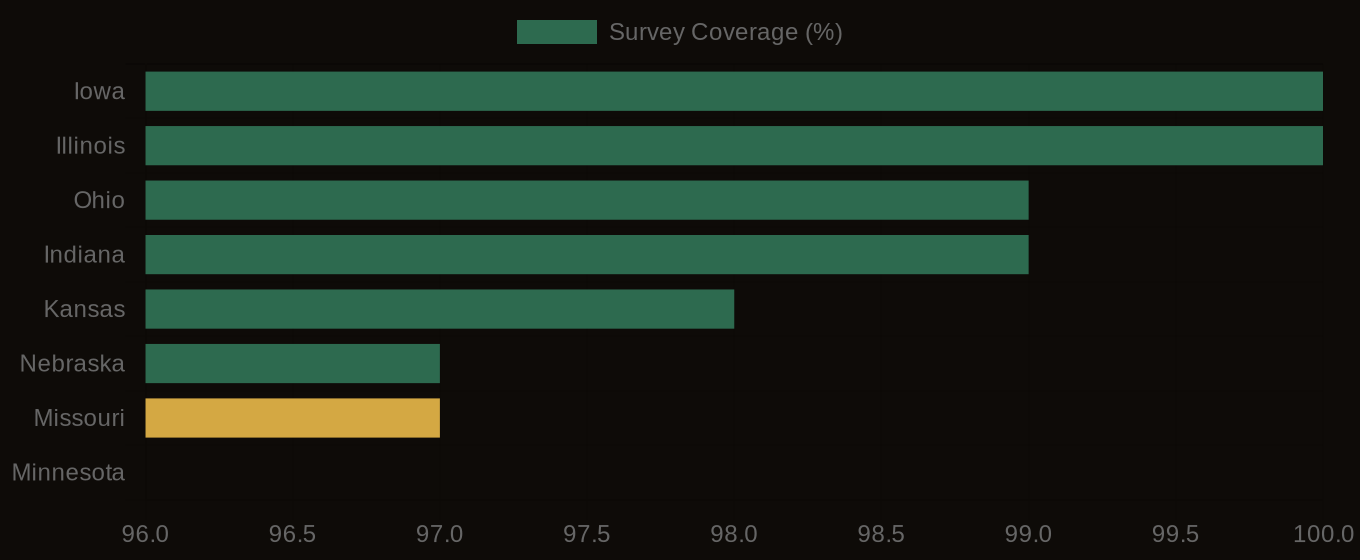
SSURGO Data Coverage - National Survey Completeness