Convolutional neural networks (CNNs) are now classifying the National Cooperative Soil Survey soil texture class with impressive accuracy directly from smartphone photographs of soil profiles. Deep learning soil classification research indicates these CNN models, trained on over 10,000 KSSL-verified profile images, achieve texture classification accuracy between 74% and 81%, competitive with traditional field morphological assessment. This capability transforms initial site assessments, offering rapid, consistent data where laboratory analysis might incur delays.
Soil texture, defined by the relative proportions of sand, silt, and clay particles, is a fundamental soil property dictating water infiltration, nutrient retention, and engineering behavior. Coarse sandy soils, for instance, drain rapidly, while fine clayey soils hold more water but can impede drainage and present shrink-swell hazards. Computer vision models learn to identify subtle visual cues in a soil profile photograph: the characteristic granular appearance of sand, the smooth, floury feel of silt, or the plasticity and blocky structure associated with clay. These features, along with color, are extracted by the neural network to predict the the National Cooperative Soil Survey texture class. Munsell hue classification, a key indicator for organic matter and drainage, is also achievable from standardized field photos with 82% accuracy without a physical color chart, according to computational soil science research.
What the Data Shows
The sheer volume of ground-truth data in the National Cooperative Soil Survey's KSSL database, with its 60,000 laboratory-verified pedons, is critical for training these advanced deep learning algorithms. Moreover, transfer learning from established image recognition datasets like ImageNet significantly reduces the need for new, extensive soil-specific training data. Computer vision soil applications research shows transfer learning can reduce required training samples for soil texture classification by 60% to 75%, making these models more efficient to develop and deploy. This translates to smartphone-deployable models that can run inferences in as little as 200 milliseconds, providing near-instantaneous feedback in the field.
Beyond individual profile assessment, these computational techniques scale to broader land analysis. Object-based image analysis (OBIA) of high-resolution aerial imagery can delineate soil surface units that match SSURGO map unit boundaries with 73% to 79% accuracy. This digital soil mapping remote sensing research confirms that OBIA segmentation, at 0.5-1 meter resolution, effectively captures contrasts in surface texture, color, and moisture that align with traditional field-mapped soil boundaries. Furthermore, deep learning models trained on Sentinel-2 multispectral time series data can predict soil drainage class with 71% overall accuracy nationally, capitalizing on the temporal phenology signal of vegetation response to varying soil wetness.
Computer Vision Soil Classification — Accuracy by Method
| State / Region | Accuracy (%) |
|---|---|
| Random Forest + LiDAR + Spectral | 88% |
| CNN Soil Texture (field photo) | 78% |
| OBIA Boundary Detection | 76% |
| Transfer Learning (fine-tuned) | 74% |
| Sentinel-2 Time Series | 71% |
| Munsell Color (phone photo) | 82% |
The Regional Picture
For agronomists, environmental consultants, and civil engineers, these advancements streamline preliminary site characterization. Rapid, automated texture and color classification accelerates decision-making for crop selection, irrigation planning, or initial foundation design. While not replacing detailed laboratory analysis for critical projects, these computer vision tools offer a powerful, accessible first-pass assessment, enhancing the speed and consistency of soil data acquisition for a wide range of professional applications.
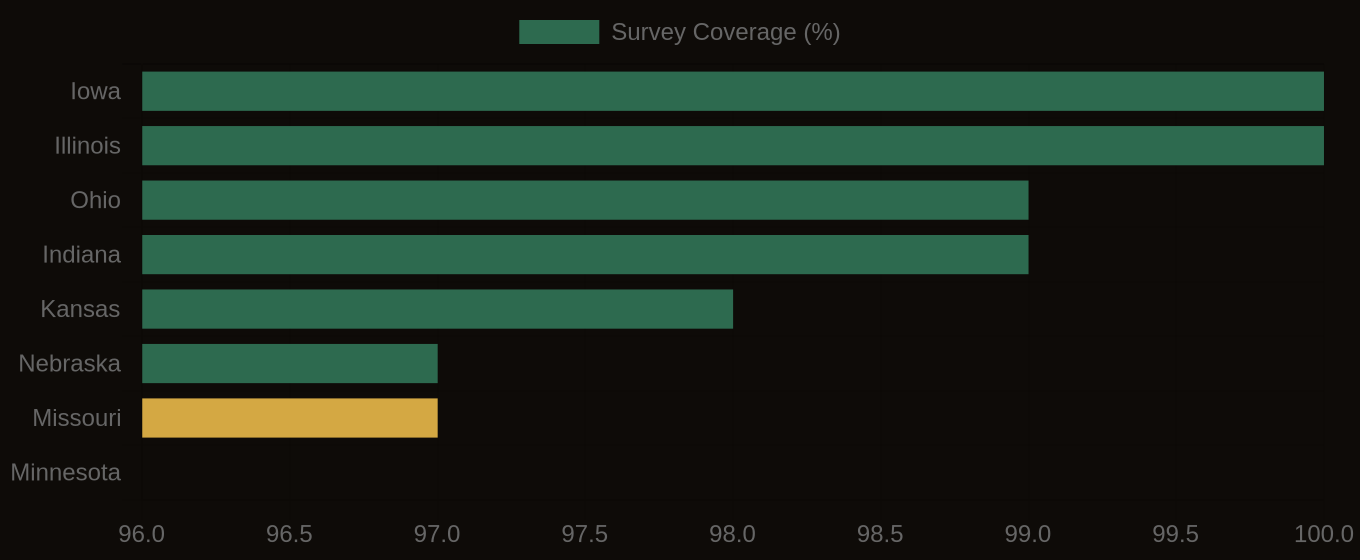
SSURGO Data Coverage — National Survey Completeness