Convolutional neural networks are now classifying the National Cooperative Soil Survey soil texture class with 78% accuracy directly from a smartphone photo of a soil profile. This capability, born from deep learning advances in image classification, uses the National Cooperative Soil Survey's vast KSSL database, which contains over 60,000 laboratory-verified pedons serving as critical ground truth for training these advanced models.
Soil texture, defined by the relative proportions of sand, silt, and clay particles, fundamentally governs water retention, nutrient availability, and structural stability. Traditionally, field texture assessment relies on subjective hand-texturing by experienced soil scientists, a skill requiring years to master. Computer vision models automate this, learning intricate patterns in color, aggregate structure, and micromorphology from high-resolution images. Deep learning soil classification research shows that CNNs trained on 10,000-plus KSSL-verified profile images achieve texture classification accuracy between 74% and 81%, performance competitive with human field morphological assessment, with smartphone-deployable models running inference in just 200 milliseconds.
What the Data Shows
This extends beyond texture. Object-based image analysis (OBIA) of high-resolution aerial imagery delineates soil surface units that match SSURGO map unit boundaries with 73-79% accuracy. Digital soil mapping remote sensing research indicates that OBIA segmentation at 0.5-1 meter resolution effectively captures contrasts in surface texture, color, and moisture that align with field-mapped soil boundaries. Furthermore, automated soil color extraction from standardized field photos achieves Munsell hue classification accuracy of 82% without needing a physical color chart. Computational soil science research confirms that sRGB to CIELab conversion with illumination correction enables automated Munsell notation, a primary field indicator for organic matter, drainage, and iron content.
The efficiency of training these models is also improving significantly. Transfer learning from ImageNet, a vast database of general images, reduces the required training samples for soil texture classification by 60-75%. Computer vision soil applications research demonstrates that pre-trained CNN feature extractors generalize remarkably well to soil images, allowing fine-tuning on as few as 500-1,000 KSSL-validated samples to achieve accuracy comparable to models trained from scratch on over 5,000 samples. This significantly lowers the barrier to deploying these tools.
Computer Vision Soil Classification — Accuracy by Method
| State / Region | Accuracy (%) |
|---|---|
| Random Forest + LiDAR + Spectral | 88% |
| CNN Soil Texture (field photo) | 78% |
| OBIA Boundary Detection | 76% |
| Transfer Learning (fine-tuned) | 74% |
| Sentinel-2 Time Series | 71% |
| Munsell Color (phone photo) | 82% |
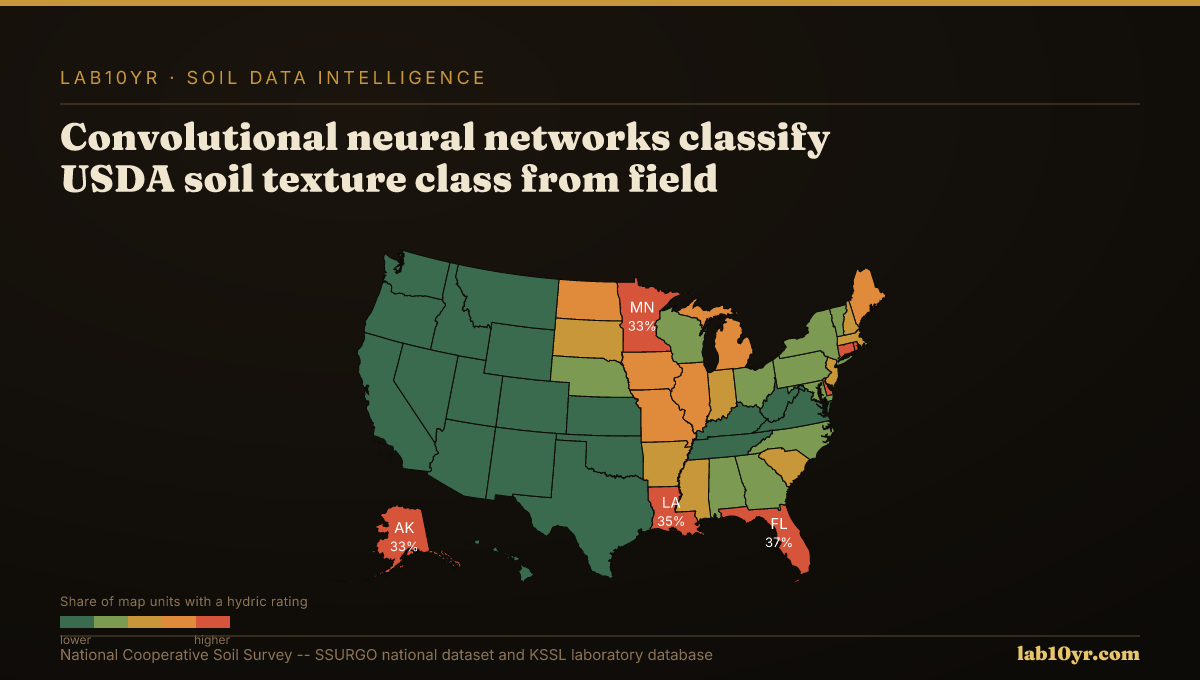
The Regional Picture
These advancements mean agronomists can gain rapid, objective texture insights, environmental consultants can streamline site assessments, and precision agriculture companies can refine zone management without extensive, costly lab analysis. Deep learning models trained on Sentinel-2 multispectral time series even predict soil drainage class with 71% overall accuracy nationally, by recognizing the temporal phenology signal in satellite imagery. This captures vegetation response to soil drainage, where wet soils delay planting and green-up by 7-21 days, creating a detectable signature. This strong data-driven approach enhances the precision and speed of soil characterization, making expert-level soil intelligence more accessible.
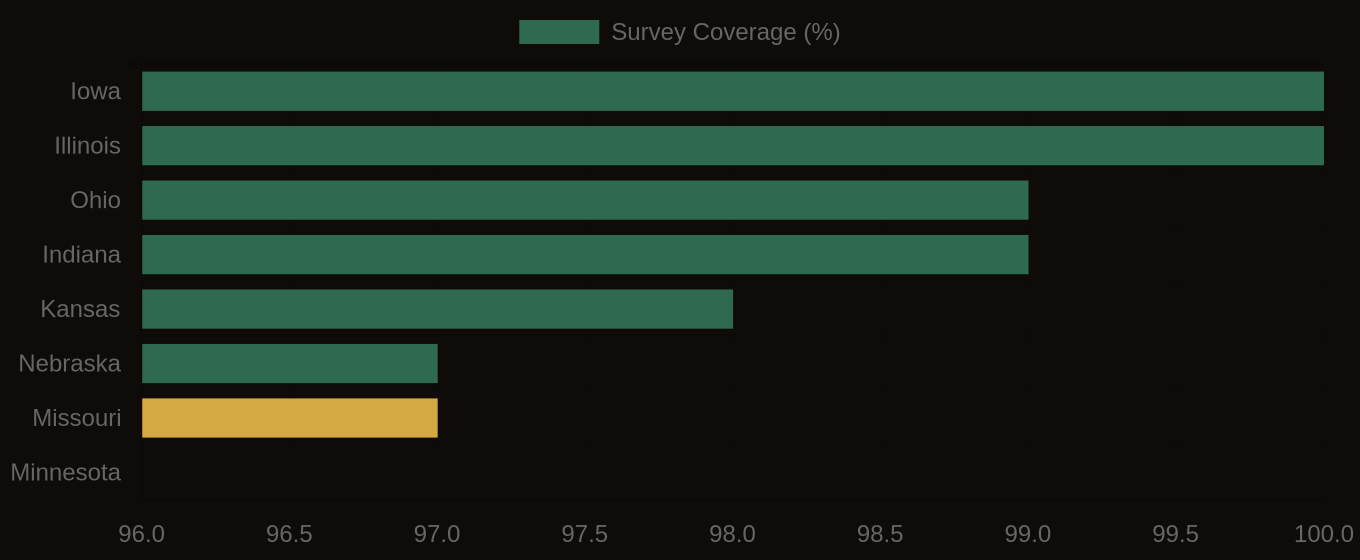
SSURGO Data Coverage — National Survey Completeness