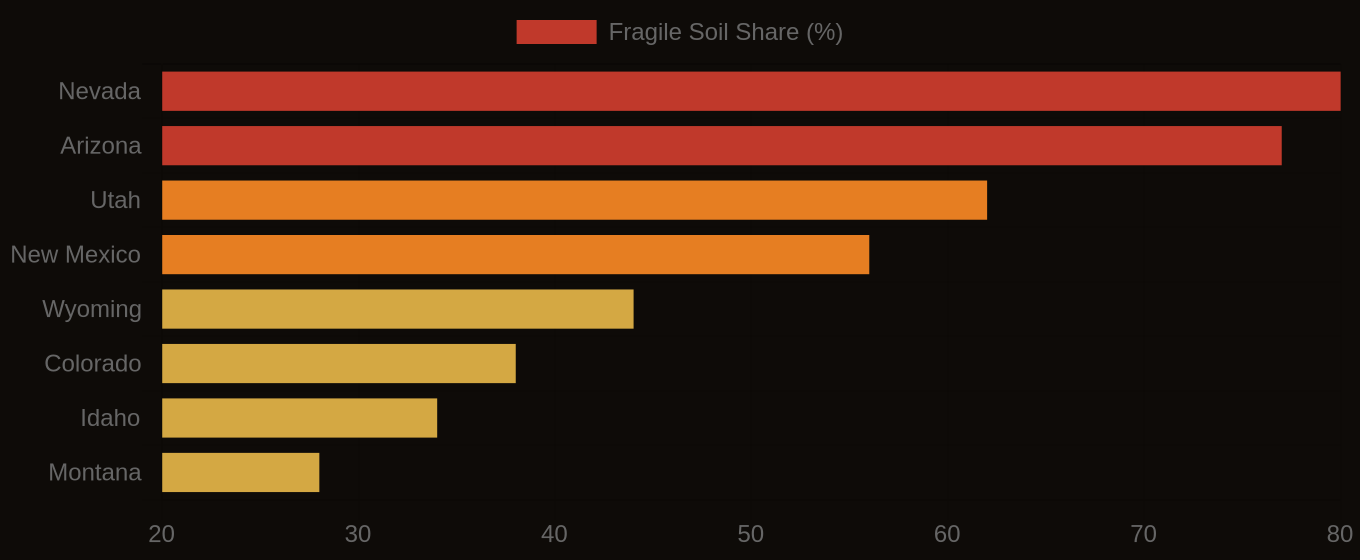
Random forest models trained on LiDAR terrain derivatives, climate rasters, and parent material data are predicting soil series with 72-88% accuracy in cross-validation. In the Rocky Mountain states, these advanced models consistently outperform legacy polygon maps derived from 1960s field traverses. This shift marks a meaningful step from traditional, labor-intensive mapping to a data-driven predictive approach, fundamentally changing how soil resources are characterized and managed.
Relief, one of the five classic soil-forming factors, directly shapes moisture regimes, erosion patterns, and the distribution of parent materials across a landscape. High-resolution LiDAR-derived products, such as digital elevation models, provide precise measures of slope, aspect, curvature, and hydrological flow accumulation. These variables, known as terrain covariates, offer powerful insights into the underlying physical processes that govern soil development. When fed into machine learning algorithms like random forest, which builds an ensemble of decision trees to aggregate predictions, these covariates enable highly accurate and spatially detailed soil series predictions.
What the Data Shows
This digital soil mapping (DSM) approach offers unparalleled resolution and consistency, critical for engineers, land managers, environmental consultants, and precision agriculture firms making site-specific decisions. Beyond terrain analysis, other machine learning methods are transforming soil characterization. For instance, convolutional neural networks classify the National Cooperative Soil Survey soil texture class from field profile photographs with 74-81% accuracy, providing rapid, consistent textural insights without traditional laboratory analysis. Object-based image analysis (OBIA) of high-resolution aerial imagery further refines spatial delineations, identifying soil surface units that match SSURGO map unit boundaries with 73-79% accuracy.
Deep learning models trained on Sentinel-2 multispectral time series predict soil drainage class with 71% overall accuracy nationally, using the subtle temporal phenology signals of vegetation as a proxy for subsurface conditions. The efficiency gains in model development are substantial; transfer learning from ImageNet reduces required training samples for soil texture classification by 60-75%. Even fundamental field observations are being automated: computational soil science research shows soil color extraction from standardized field photos achieves Munsell hue classification accuracy of 82% without a physical color chart, streamlining a primary indicator for organic matter and drainage. These technological advancements enable faster, more cost-effective, and higher-resolution soil intelligence, providing a critical foundation for complex project planning and risk assessment.
Terrain Derivative Accuracy — Predicting SSURGO Drainage Class
| State / Region | Accuracy (%) |
|---|---|
| Random Forest (all derivatives) | 83% |
| Topographic Wetness Index | 79% |
| Geomorphon + TWI | 76% |
| Slope Position Index | 68% |
| Profile Curvature | 62% |
| Slope Angle Only | 44% |
| Legacy SSURGO Polygon | 71% |
The Regional Picture
Fragile Soil Index Across America