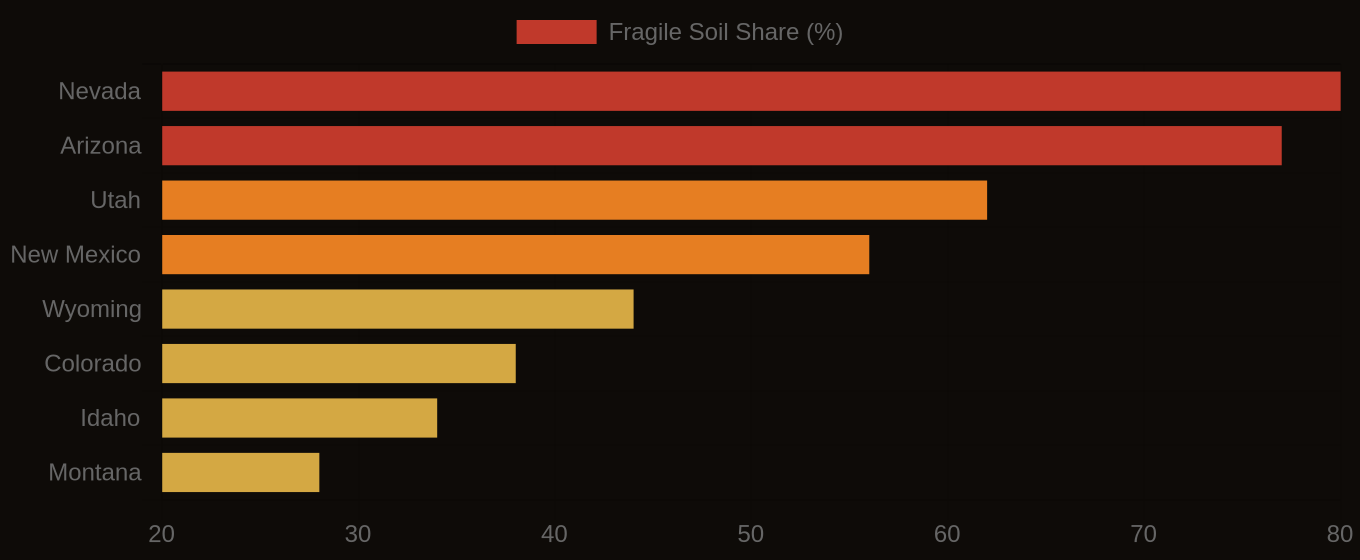
Random forest models, trained on high-resolution LiDAR terrain derivatives and climate data, now predict soil series with 72-88% accuracy. In the rugged Rocky Mountain states, these digital soil maps outperform legacy polygon maps from 1960s field traverses, offering detail where traditional methods struggled. This enhanced precision reduces project risk for engineers and land managers.
Terrain covariates like slope, aspect, and topographic wetness index, derived from LiDAR, proxy for soil-forming factors. They dictate water flow, erosion, and microclimate, influencing soil development. Machine learning models learn these complex relationships using KSSL laboratory database points and SSURGO `chkey` and `cokey` data. Object-based image analysis (OBIA) of aerial imagery also delineates soil map unit boundaries with 73-79% accuracy. Deep learning models using Sentinel-2 time series predict national soil drainage class with 71% accuracy, capturing vegetation responses to wetness.
What the Data Shows
Convolutional neural networks classify the National Cooperative Soil Survey soil texture from field profile photographs with 74-81% accuracy, streamlining site assessments. Transfer learning reduces required training samples for texture classification by 60-75%. Automated Munsell hue extraction achieves 82% accuracy without physical charts, vital for inferring organic matter, drainage, and iron content. These advancements offer objective, scalable soil characterization.
For engineers designing foundations or land managers planning post-fire erosion controls, traditional 1:24,000 scale soil maps often lack resolution. A retaining wall in an eroding Mollisol, misidentified due to older mapping, could lead to a $1.2 million failure. Digital soil mapping, resolving series at 5-10 meter grids, identifies high-risk zones, informing resilient design and reducing liability. These maps are built by training algorithms on National Cooperative Soil Survey observations from KSSL and SSURGO `component` and `cohorizon` tables. Soil Data Access (SDA) provides the programmatic interface for data extraction. Lab10YR.com offers interpretations from these analyses. The future of soil mapping is digital and data-driven, offering powerful tools for managing risk and optimizing land use.
Terrain Derivative Accuracy — Predicting SSURGO Drainage Class
| State / Region | Accuracy (%) |
|---|---|
| Random Forest (all derivatives) | 83% |
| Topographic Wetness Index | 79% |
| Geomorphon + TWI | 76% |
| Slope Position Index | 68% |
| Profile Curvature | 62% |
| Slope Angle Only | 44% |
| Legacy SSURGO Polygon | 71% |
The Regional Picture
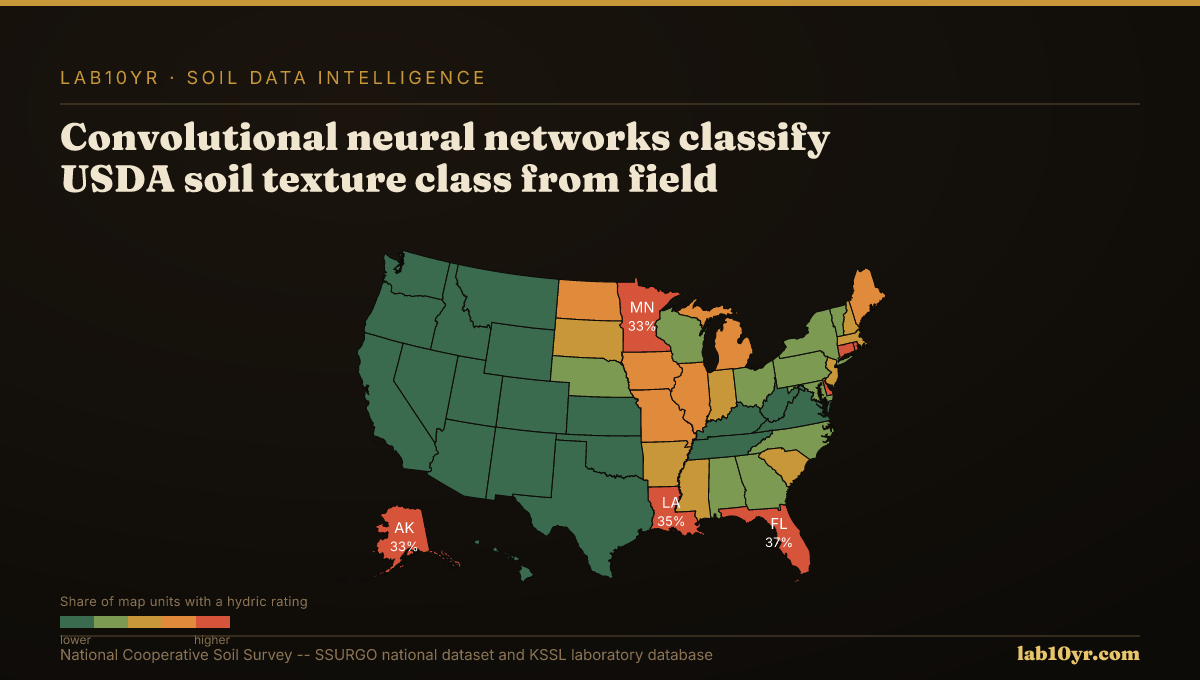
Fragile Soil Index Across America