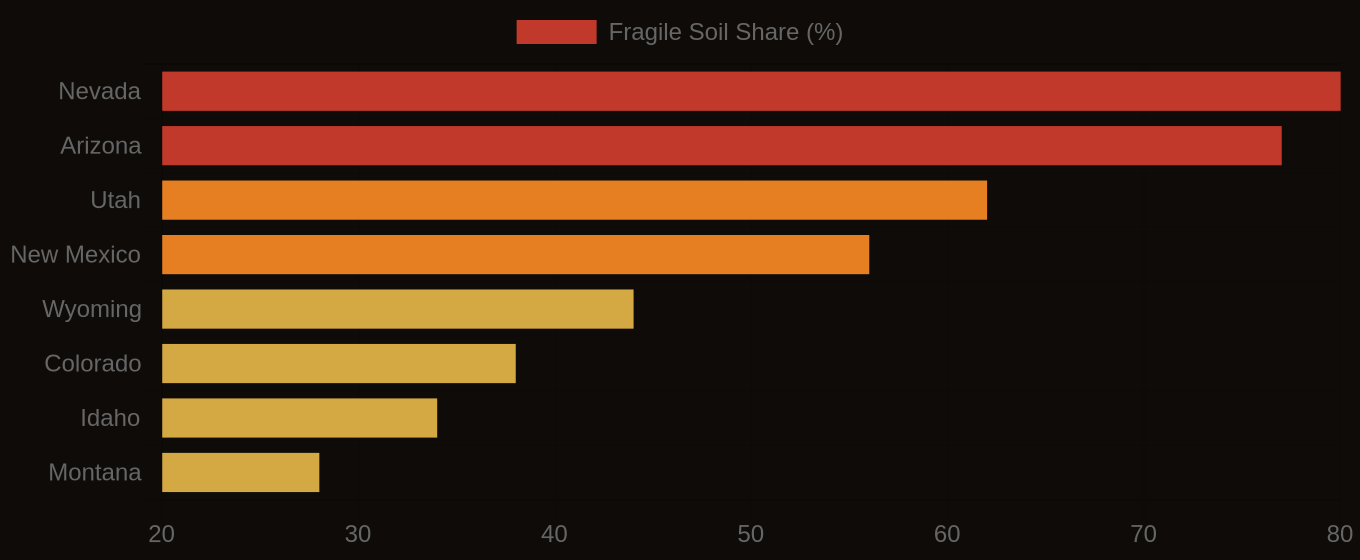
Random forest models, trained on high-resolution LiDAR terrain derivatives, regional climate rasters, and parent material data, are now predicting soil series with 72-88% accuracy in cross-validation. In critical areas of the Rocky Mountain states, these advanced digital soil maps consistently outperform legacy polygon maps derived from field traverses conducted as far back as the 1960s. This shift represents a fundamental re-evaluation of how soil information is generated and applied in professional contexts.
Digital soil mapping (DSM) uses machine learning algorithms to establish quantitative relationships between observable environmental features, known as terrain covariates, and measured soil properties. LiDAR, or Light Detection and Ranging, provides highly detailed elevation data, from which covariates like slope, aspect, and topographic wetness index are computed. These features, combined with climate data and geological parent material maps, offer a rich explanatory framework for soil formation processes. Random forest, a powerful ensemble learning method, builds numerous decision trees and aggregates their predictions, effectively capturing complex, non-linear relationships that traditional mapping struggled to delineate. This allows for more precise interpolation between widely spaced field observations, enhancing the granularity and accuracy of soil property maps.
What the Data Shows
Beyond soil series prediction, machine learning extends its utility across the spectrum of soil characterization. Convolutional neural networks (CNNs), for instance, classify the National Cooperative Soil Survey soil texture class from field profile photographs with 74-81% accuracy; these models, trained on over 10,000 KSSL-verified images, provide rapid, objective assessments. Object-based image analysis (OBIA) of high-resolution aerial imagery delineates soil surface units that match SSURGO map unit boundaries with 73-79% accuracy, capturing critical surface texture and moisture contrasts. Deep learning models trained on Sentinel-2 multispectral time series predict soil drainage class with 71% overall accuracy nationally, by discerning vegetation phenology signals linked to soil wetness. Furthermore, computational soil science research indicates that soil color extraction from standardized field photos achieves Munsell hue classification accuracy of 82% without a physical color chart, offering an automated primary indicator for organic matter and drainage.
This evolution in digital soil mapping offers land managers, environmental consultants, and precision agriculture firms an unprecedented level of detail and predictive power. It moves beyond generalized polygons to continuous, gridded data layers that reflect true soil variability at a finer scale. By integrating these advanced predictive models with foundational data from the National Cooperative Soil Survey, professionals gain access to more reliable and granular soil information, critical for site-specific engineering designs, targeted conservation efforts, and optimized agricultural practices. This data-driven approach refines risk assessments and improves decision-making across diverse land-based industries.
Terrain Derivative Accuracy — Predicting SSURGO Drainage Class
| State / Region | Accuracy (%) |
|---|---|
| Random Forest (all derivatives) | 83% |
| Topographic Wetness Index | 79% |
| Geomorphon + TWI | 76% |
| Slope Position Index | 68% |
| Profile Curvature | 62% |
| Slope Angle Only | 44% |
| Legacy SSURGO Polygon | 71% |
The Regional Picture
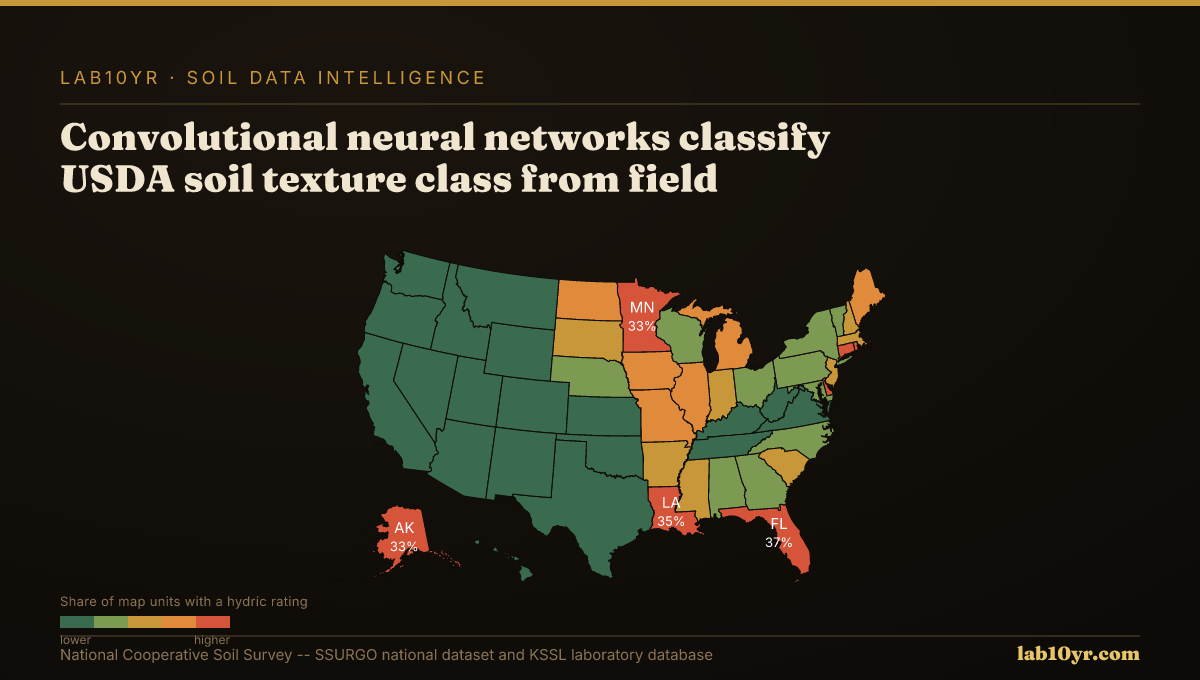
Fragile Soil Index Across America