Fragile soil is a problem. The national soil survey, compiled by the National Cooperative Soil Survey, reveals a complex landscape of soil conditions across 2.3 million map units. Most road budgets fail to account for the impact of fragile soils on infrastructure cost, a significant oversight for civil engineers, county planners, and transportation agencies.
Soil conditions vary widely. 13.3 percent of rated SSURGO map units carry a Fragile or higher FSI rating, which translates to 28,122 of 211,283 rated map units. This indicates a substantial portion of the country's soil is prone to fragility.
Where the Risk Lives
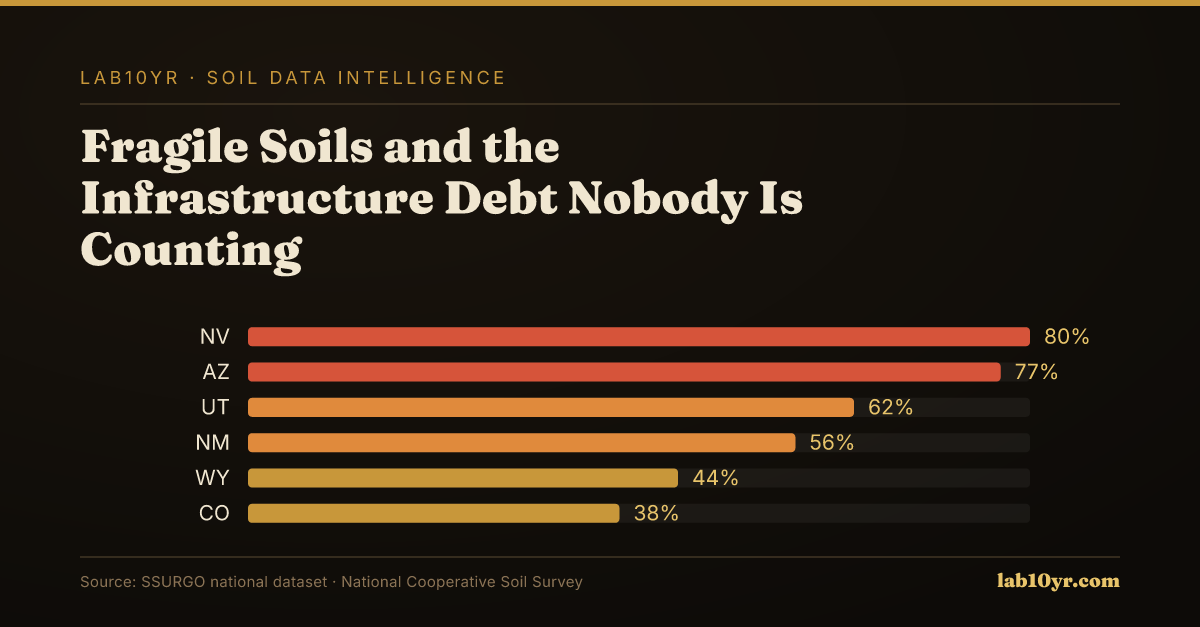
A major concern. The Fragile Soil Index, or FSI, measures soil stability, with values above 0.5 indicating elevated fragility risk. The national average FSI value is 0.272 on a 0-to-1 scale. Some states have much higher average FSI values: Nevada's average FSI is 0.521, and Arizona's is 0.495.
Regional differences are striking. Eighty percent of Nevada's map units are rated Fragile or higher, while 77 percent of Arizona's map units carry the same rating. This information is vital for infrastructure planning, as fragile soils can significantly impact construction costs and geotechnical stability.
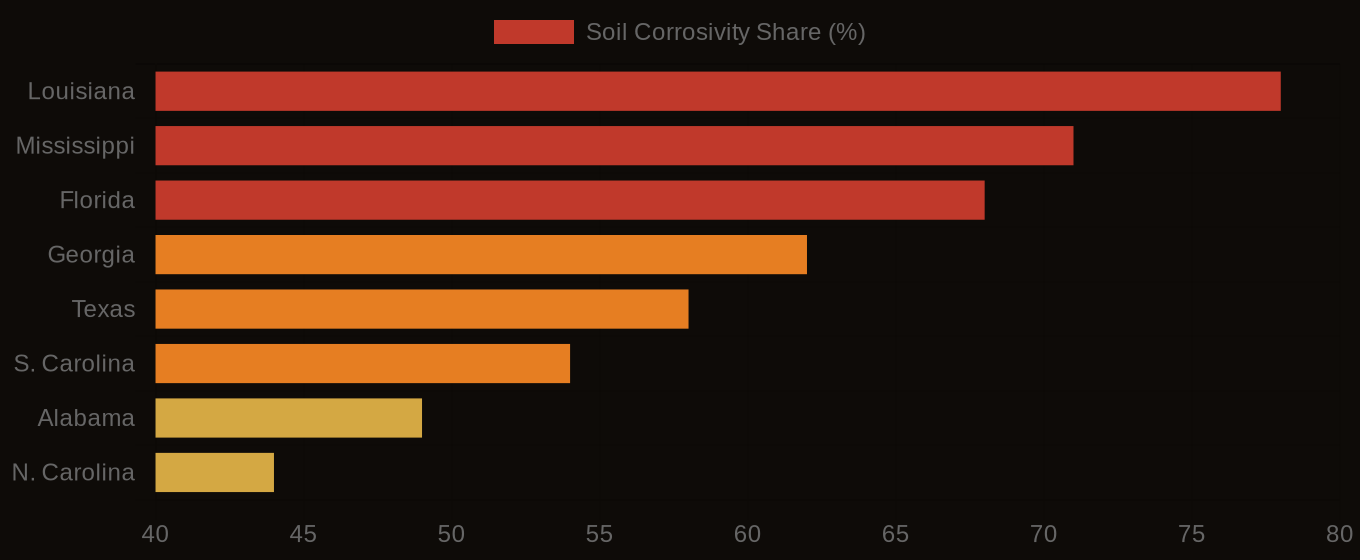
Soil Corrosivity Risk - Top U.S. Infrastructure States
| State / Region | High Corrosivity (%) |
|---|---|
| Louisiana | 78% |
| Mississippi | 71% |
| Florida | 68% |
| Georgia | 62% |
| Texas | 58% |
| S. Carolina | 54% |
| Alabama | 49% |
| N. Carolina | 44% |
| Virginia | 38% |
| Pennsylvania | 31% |
The Cost Nobody Budgets For
Soil fragility has serious consequences. Fragile soils are more susceptible to erosion, landslides, and other geotechnical hazards, leading to significant increases in construction costs, as well as maintenance and repair costs over the lifespan of the infrastructure.
Understanding soil conditions is key. Civil engineers and county planners must consider the Fragile Soil Index and other soil-related factors to make informed decisions about infrastructure development. By doing so, they can better plan and design infrastructure projects that are resilient and cost-effective.
Soil Corrosivity Risk - Infrastructure Exposure by State
A Ledger the Industry Must Open
The implications are clear. Acknowledging the impact of soil fragility on construction costs and geotechnical stability, civil engineers, county planners, and transportation agencies can make more informed decisions about infrastructure development.com, or support this work at ko-fi.com/lab10yr.