A bare soil composite, built from 20 years of Landsat imagery in Google Earth Engine, isolates spectral signals correlating with soil organic carbon (SOC) at 30-meter resolution. The Kellogg Soil Survey Laboratory (KSSL) provides laboratory validation. This capability makes a national carbon change map computationally achievable, transforming carbon project development and precision agriculture.
SOC profoundly influences bare soil's spectral reflectance. Organic matter absorbs more light in the visible and near-infrared regions, yielding a distinct spectral signature. Time series analysis of satellite images filters transient noise, isolating the consistent soil signal. Google Earth Engine supplies petabyte-scale power to process decades of Landsat data at 30-meter resolution.
What the Data Shows
The accuracy of these remote sensing models demands strong ground truth. The National Cooperative Soil Survey's KSSL database contains precise lab measurements of soil properties, including organic carbon. KSSL data, accessed via Soil Data Access (SDA) through `kssl.lab_major` and `kssl.lab_chemical`, enables calibration and validation of spectral indices against actual measured SOC.
Monitoring soil carbon offers opportunities for carbon credit verification, ESG reporting, and optimizing regenerative agriculture. However, carbon sequestration's permanence is not solely dependent on monitoring; soil stability is critical. Fragile soils, prevalent in arid regions, complicate carbon retention.
Soil Carbon Prediction Accuracy — Spectral vs. Traditional Methods
| State / Region | R² — SOC Prediction |
|---|---|
| UAV Multispectral (5cm) | 0.87% |
| Vis-NIR-SWIR Lab Scan | 0.84% |
| Sentinel-2 Bare Soil | 0.71% |
| Landsat Composite | 0.63% |
| Field Morphology | 0.55% |
| Grid Sampling | 0.48% |
The Regional Picture
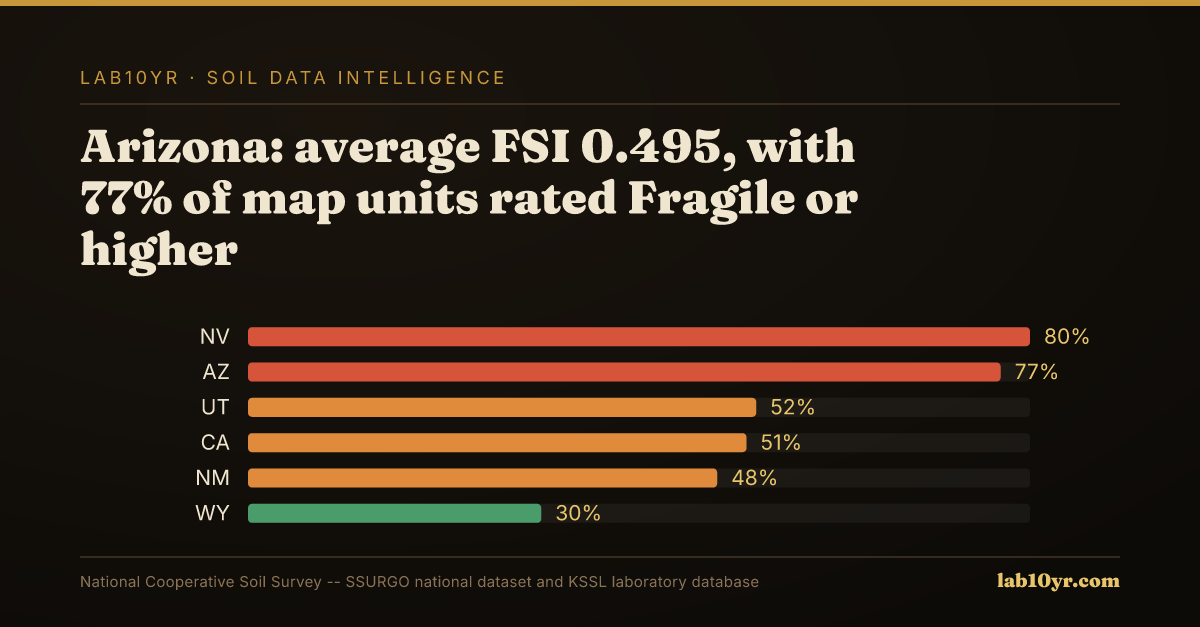
Nevada's soils average a Fragile Soil Index (FSI) of 0.521, highest in the continental U.S., with 80% of map units rated Fragile or higher. These desert soils, low in organic matter, offer minimal cohesion. Arizona follows with an average FSI of 0.495, with 77% of map units Fragile or higher, reflecting conditions prone to aggregate breakdown. Overall, 13.3% of rated SSURGO map units carry a Fragile or higher FSI, concentrated in the Southwest.
Utah's soils, averaging an FSI of 0.41 (62% of map units Fragile or higher), include Great Basin and Colorado Plateau soils that collapse on wetting. This impacts organic matter's physical protection within aggregates, influencing persistence. While remote sensing tracks carbon, understanding these fragility metrics, available in SSURGO via `chfrags_r`, is vital for designing resilient carbon projects that account for soil's physical vulnerability.
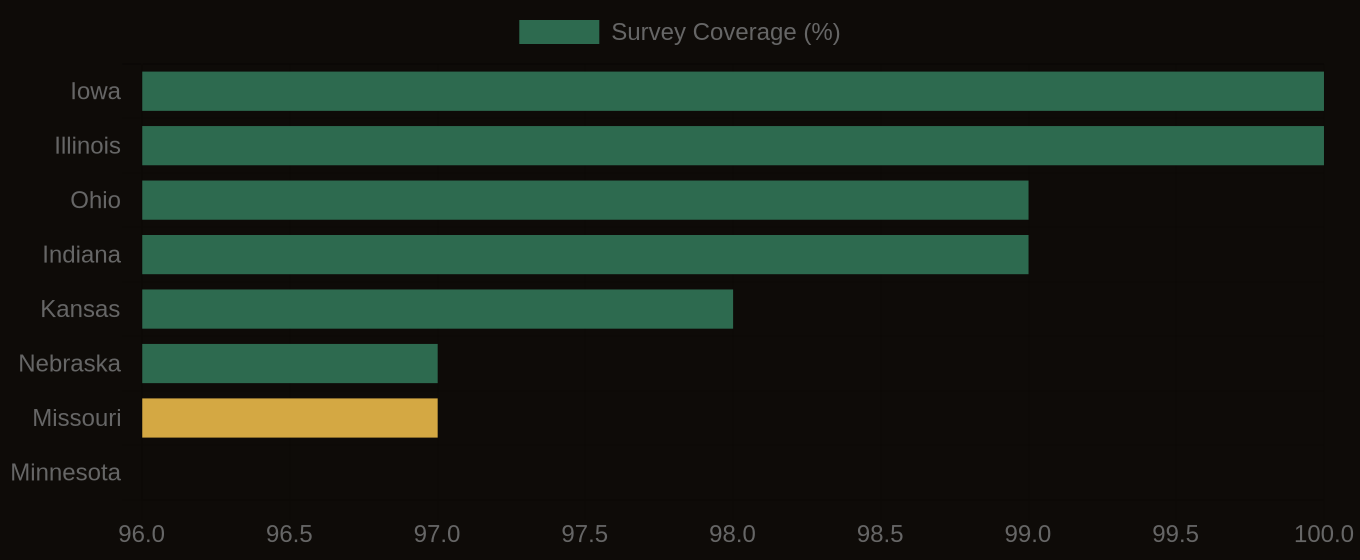
SSURGO Data Coverage — National Survey Completeness