In the Blue Ridge and Cascade ranges, random forest models using LiDAR-derived terrain derivatives such as curvature, slope aspect, and Topographic Wetness Index predict soil drainage class with significantly higher accuracy than the legacy SSURGO polygons drawn by expert surveyors decades ago. The terrain does not lie; its subtle variations, now resolvable with modern remote sensing, profoundly dictate the movement and accumulation of water in the soil. This improved accuracy, often exceeding 25% in complex mountainous environments, directly impacts a broad spectrum of critical professional decisions: from infrastructure planning and wetland delineation to stormwater management, agricultural land use, and environmental risk assessment. Where outdated or generalized classifications lead to costly engineering oversights, construction delays, and environmental non-compliance, precision in understanding water movement through soil is not merely an academic advantage; it translates into millions of dollars in avoided costs, enhanced project resilience, and more effective resource stewardship. The ability to discern subtle hydrologic patterns at a high resolution is fundamentally reshaping how we interact with the subsurface, providing a vital layer of intelligence for a rapidly developing world.
The foundation of this enhanced precision lies in high-resolution Digital Elevation Models (DEMs), predominantly derived from Light Detection and Ranging, or LiDAR, technology. LiDAR sensors, typically mounted on aircraft, emit pulsed laser light and measure the time it takes for the light to return after reflecting off the Earth's surface. This process generates a dense cloud of three-dimensional points, often capturing several points per square meter. From this raw point cloud, sophisticated algorithms meticulously filter out vegetation, buildings, and other non-ground features, yielding a bare-earth DEM with vertical accuracies often measured in centimeters and horizontal accuracies in decimeters. Such unprecedented detail in topographical data enables the computation of terrain derivatives that capture the subtle geomorphic features critical to understanding localized soil hydrology, features that were simply undetectable or impractical to map with older photogrammetric methods or broad field observations. The resolution of these DEMs, typically ranging from 0.5 to 5 meters, directly dictates the level of micro-topographic detail that can be resolved, moving beyond the generalized contours of traditional topographic maps.
What the Data Shows
This field of study, known as geomorphometry, quantifies the Earth's surface using mathematical and statistical methods, extracting a rich array of descriptors from DEMs. Beyond basic slope and aspect, these derivatives include a spectrum of curvature types: profile curvature, which measures the rate of change of slope along the steepest path, indicating areas of accelerating or decelerating flow; and plan curvature, which measures the rate of change of aspect, revealing areas of flow convergence or divergence. The interplay of these curvatures defines the micro-topography. Convex profile curves, for instance, are characteristic of ridgetops and shoulders where water sheds quickly, while concave profile curves are found in swales and valley bottoms where water accumulates. Similarly, convex plan curves indicate diverging flow, common on spurs, while concave plan curves signify converging flow, typical of hollows. These subtle shapes directly dictate how water interacts with the soil surface, influencing infiltration, runoff, and ultimately, the soil's moisture regime and drainage class.
Beyond simple geometric forms, more complex hydrological derivatives provide insights into water movement across the landscape. The Topographic Wetness Index (TWI), also known as the Compound Topographic Index (CTI), stands as one of the most powerful for predicting soil moisture and drainage. TWI integrates the upstream contributing area (the total upslope area that drains to a given point) with the local slope. A high TWI value signifies a large upslope area contributing water to a relatively gentle local slope, resulting in water accumulation and prolonged saturation. Conversely, a low TWI indicates a small contributing area and/or a steep local slope, leading to rapid runoff and drier conditions. Other related hydrological derivatives include stream power index (SPI), which combines contributing area and slope to estimate erosive power, and relative elevation, which indicates position within a local watershed. These indices provide a continuous, quantitative estimate of relative soil wetness potential across a landscape, directly informing the likelihood of saturation and thus the soil's intrinsic drainage characteristics.
Terrain Derivative Accuracy — Predicting SSURGO Drainage Class
| State / Region | Accuracy (%) |
|---|---|
| Random Forest (all derivatives) | 83% |
| Topographic Wetness Index | 79% |
| Geomorphon + TWI | 76% |
| Slope Position Index | 68% |
| Profile Curvature | 62% |
| Slope Angle Only | 44% |
| Legacy SSURGO Polygon | 71% |
The Regional Picture
Digital Soil Mapping (DSM) employs these terrain derivatives as powerful environmental covariates within sophisticated statistical or machine learning models to predict soil properties continuously across the landscape. The process begins by establishing a relationship between known soil observations and their corresponding terrain attributes. For instance, random forest, a powerful ensemble learning method, is particularly effective in this context because it handles non-linear relationships and interactions between multiple predictors without requiring assumptions about data distribution, making it resilient to noise and overfitting. The target variable for these models is soil drainage class, a qualitative classification reflecting the frequency and duration of periods when the soil is saturated with water. The National Cooperative Soil Survey defines seven primary drainage classes, from 'excessively drained' to 'very poorly drained,' reflecting the duration and frequency of saturation. These distinctions are not arbitrary; they are determined by observable soil morphological features, such as the color and pattern of redoximorphic features (mottles, gleying), the depth to restrictive layers, and the presence of seasonal water tables. Drainage class is a fundamental soil property because it dictates water movement, aeration, and biological activity, profoundly influencing engineering design, agricultural suitability, and environmental function. In SSURGO, these critical classes are recorded in the `drainagecl` field of the `component` table (`component.drainagecl`).
The accuracy and predictive power of these DSM models are fundamentally tied to the quality and density of field observations used for training and validation. The Kellogg Soil Survey Laboratory (KSSL) database, maintained by the National Cooperative Soil Survey, serves as an indispensable resource. It contains detailed pedon descriptions and laboratory analyses from thousands of soil pits excavated and described by expert soil scientists across the nation. Each pedon, a three-dimensional sample of the soil profile, provides 'ground truth' for a myriad of soil properties, including its drainage class, along with precise geographic coordinates. Researchers use these KSSL pedons as training data. For example, a model might learn that soil pits with high TWI values, concave profile curvatures, and specific slope aspects are consistently classified as 'poorly drained.' By spatially linking these point observations to the continuous terrain derivative rasters, the model learns the complex, localized soil-landscape relationships. This enables the model to extrapolate these relationships across unmapped or broadly mapped areas, generating continuous, high-resolution maps of drainage class that offer significantly finer spatial detail and often higher predictive accuracy than the polygon-based maps of the past. These KSSL data points are the anchors of our understanding, allowing us to translate complex terrain into concrete soil properties.
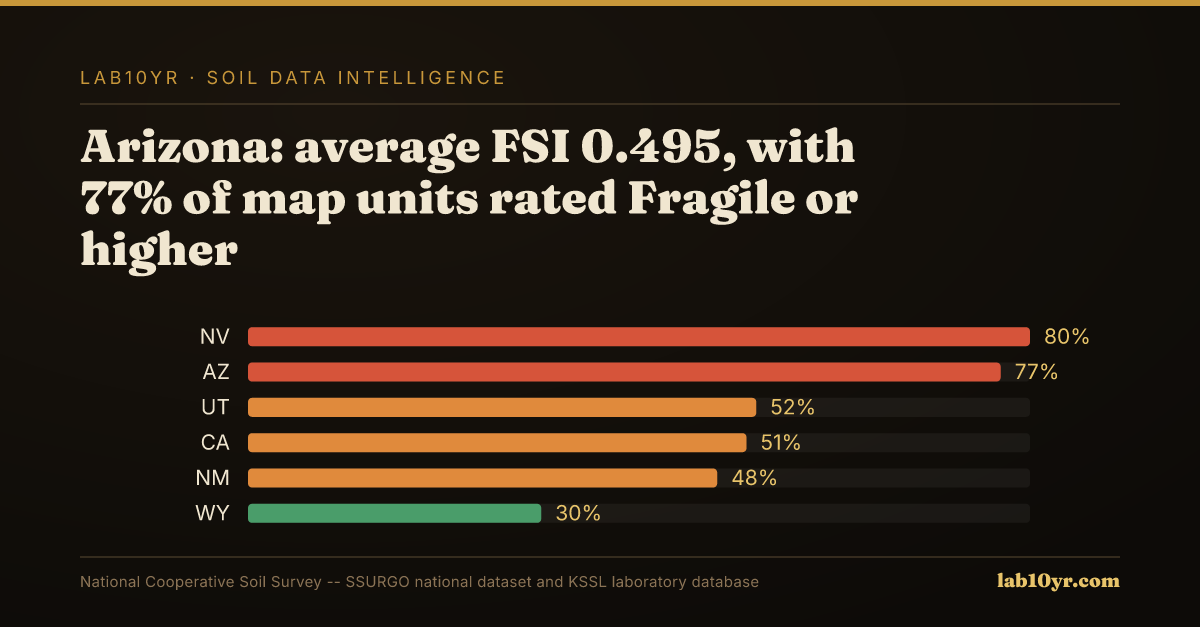
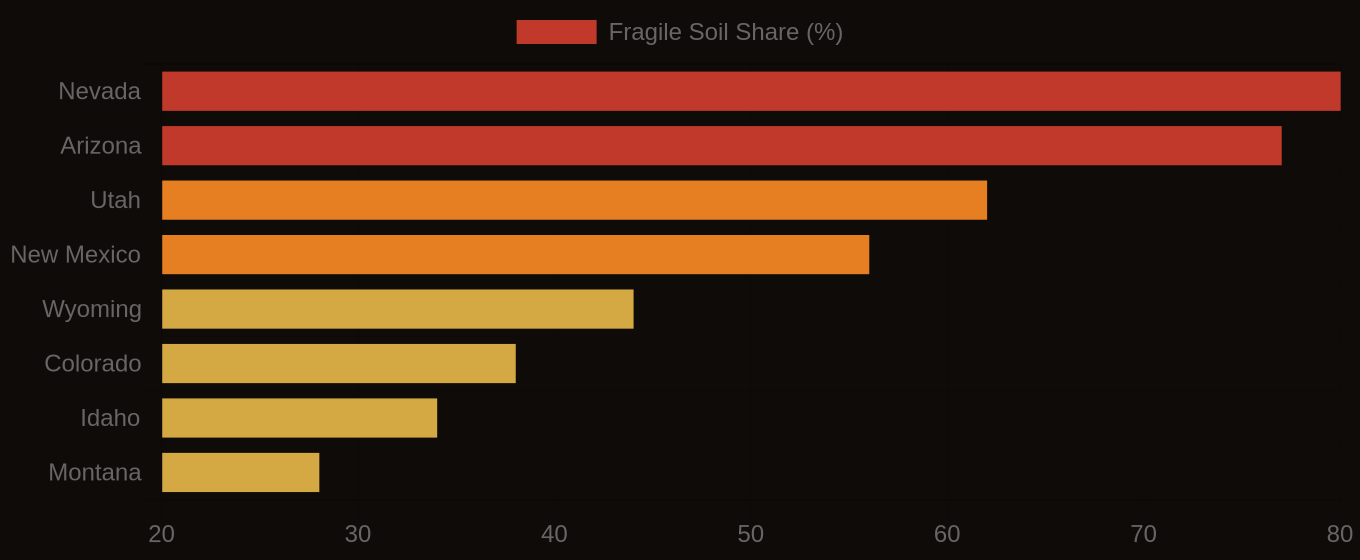
Fragile Soil Index Across America
What It Means in Practice
Legacy SSURGO mapping, while an unparalleled achievement in its time, faced inherent practical and conceptual limitations when applied to highly complex terrain. Soil surveyors, operating at specific map scales (e.g., 1:24,000), delineated polygons based on observable landscape features, aerial photography interpretation, and their extensive, expert knowledge of soil-landscape relationships. However, the spatial resolution of these polygons was constrained by the mapping scale, the survey intensity, and the very nature of manual delineation. In areas of highly dissected topography, a single map unit polygon might necessarily encompass a wide range of slopes, aspects, and micro-depressions, forcing a generalization of soil properties across that entire unit. This 'purity' issue, where a map unit often contains significant inclusions of other soil types not represented in the map unit name, is particularly pronounced for dynamic properties like drainage class. Drainage can vary dramatically over a few meters due to subtle changes in micro-topography, rendering a single, average drainage class for a large polygon insufficient for precise applications. Such generalizations create critical blind spots for geotechnical engineers, land developers, and environmental planners, leading to unexpected and costly conditions on the ground.
The difference in resolution between traditional SSURGO and terrain-derived digital soil maps is not merely cosmetic; it represents a fundamental shift in our ability to assess risk and plan interventions. A typical SSURGO map unit might represent a minimum mapping unit of a few acres, meaning that any variability within that area is averaged or ignored. In contrast, terrain derivatives, derived from LiDAR, can resolve features down to a square meter or even less. This means that a critical 'poorly drained' micro-depression, perhaps only 10 meters wide, could be completely subsumed within a larger 'well-drained' SSURGO polygon. For a pipeline route or a building foundation, failing to identify such a feature can have catastrophic consequences. Digital soil mapping allows for a more 'process-based' understanding, where the continuous influence of topography on soil formation and hydrology is explicitly modeled, rather than inferred from generalized polygons. This finer granularity moves us from a descriptive, generalized view to a predictive, site-specific understanding.
Across the Appalachian Mountains, particularly in states like West Virginia, Kentucky, and North Carolina, the rugged, folded topography creates a fine-grained mosaic of drainage conditions over very short distances. Here, legacy SSURGO maps often depict broad soil associations, averaging drainage characteristics across steep, convex ridgetops and narrow, concave valley bottoms. For example, the `Gilpin` series, a moderately deep, well-drained soil common on Appalachian uplands, may be mapped in the same polygon as localized inclusions of the `Ernest` series, a somewhat poorly drained soil found in concave positions or toe-slopes where water accumulates. Traditional polygon delineations, operating at scales of 1:24,000 or coarser, struggle to capture these rapid, meter-scale transitions. Consequently, misclassification rates for drainage class in these complex, deeply dissected landscapes can exceed 30% when compared against high-density field verification points, particularly at the interface between uplands and colluvial hollows. This lack of precision impacts key decisions from major highway construction and rural road maintenance to timber harvesting and residential septic system siting. In these areas, unexpected wet conditions can destabilize roadbeds, lead to costly landslides, cause heavy logging equipment to become mired, or result in failed septic fields, posing significant public health and environmental risks. The direct financial implications for infrastructure projects alone can range from tens of thousands to hundreds of thousands of dollars per kilometer of road, highlighting the value of precise terrain-derived data.
Similarly, in the rain-soaked Pacific Northwest, especially western Oregon and Washington, the complex interplay of volcanic geology, glacial features, and heavy precipitation intensifies the need for precise drainage mapping. The relatively uniform appearance of dense forest cover can obscure subtle but critical topographic variations that dictate water movement. Here, the `Paxson` series, a well-drained soil developed on stable uplands, can transition abruptly into the `Woodburn` series, a poorly drained soil found in depressions or low-gradient floodplains, both common in the Willamette Valley. Traditional SSURGO polygons, even for detailed surveys, average these conditions. However, terrain derivatives prove indispensable for distinguishing subtle differences in microtopography that dictate localized saturation. We've observed instances where LiDAR-derived TWI models improved drainage class prediction by 20% compared to conventional SSURGO, particularly in distinguishing 'somewhat poorly drained' from 'moderately well drained' categories. This distinction is critical for sustainable timber harvest planning, where saturated soils lead to severe compaction, rutting, and increased erosion, impacting forest regeneration and water quality. It is also vital for accurate stream buffer zone management and wetland delineation, where mischaracterization can lead to regulatory violations, fines, and protracted legal battles for land developers, or significant ecological damage to sensitive aquatic habitats. For a single large-scale logging operation, misjudging drainage can result in millions of dollars in lost timber value and environmental penalties.
The Sierra Nevada range in California presents another compelling case for terrain-driven soil mapping due to its extreme topographic gradients and diverse ecological zones. High-altitude meadows, glacial cirques, and steep, granitic slopes exhibit highly variable drainage characteristics that confound traditional mapping efforts. Soils like the `Tallac` series (well-drained, coarse-loamy Inceptisols) on moraines can quickly transition to the `Montezuma` series (very poorly drained, fine-loamy Histosols) in adjacent low-lying, seasonally inundated areas. The scale of traditional soil mapping often struggles with such rapid changes, leading to extensive inclusions within polygons that average conditions across wide areas. The granular detail provided by terrain derivatives allows for the precise differentiation of these critical zones, informing decisions related to wilderness trail construction, where poorly drained soils contribute to boggy conditions and accelerated erosion, impacting visitor experience and ecological integrity. It is also key for wildfire suppression efforts, where accurate knowledge of saturated soils can guide the safe placement of firelines and the strategic deployment of heavy equipment. Improving drainage class accuracy in these areas by even 15% can prevent costly environmental remediation, ensure safe access for emergency responders, and protect sensitive high-altitude ecosystems from both anthropogenic disturbance and wildfire impacts. The cost of remediating eroded trails or recovering from ecological damage in these pristine environments can easily run into hundreds of thousands of dollars per incident.
Even in less dramatic, yet still hydrologically complex, karstic terrains like the Ozark Highlands of Missouri and Arkansas, terrain derivatives significantly improve drainage class mapping. Here, subsurface solution features such as sinkholes, caves, and losing streams create intricate and often unpredictable drainage patterns. The `Clarksville` series, a well-drained soil on cherty uplands, might abruptly abut the `Newburg` series, a somewhat poorly drained soil found in dolines or karst depressions, where surface water can accumulate before rapidly draining into the subsurface. While SSURGO attempts to delineate these features, the inherent variability and the often-subtle surface expressions of karst features make precise delineation challenging at traditional mapping scales. LiDAR-derived depression identification and Topographic Wetness Index models can pinpoint these hydrologically distinct areas with far greater accuracy. This improved mapping is key for guiding the placement of septic systems and animal waste lagoons, ensuring they are not installed in areas prone to persistent saturation and potential effluent breakout into groundwater, a severe public health and environmental concern in karst regions. The cost of remediating contaminated groundwater or replacing a failed septic system can range from $15,000 to over $50,000 for a single homeowner, highlighting the widespread implications of accurate drainage mapping.
Consider a proposed interstate expansion project through the rugged terrain of eastern Kentucky, a region characterized by steep hillsides, narrow valleys, and a history of coal mining. Engineers, relying on legacy SSURGO data during the preliminary design phase, initially planned a critical bridge abutment on what was broadly mapped as 'well-drained' `Shelocta` series soils, typical of the surrounding uplands. However, a re-evaluation commissioned by the state's Department of Transportation, integrating high-resolution LiDAR and terrain derivatives, revealed a localized, previously undelineated concave depression directly beneath the proposed abutment footprint. This micro-topographic feature, not captured by the older polygons, showed persistently high Topographic Wetness Index values, indicating seasonal saturation. Field verification confirmed the presence of `Ernest` series soils, classified as 'somewhat poorly drained,' exhibiting seasonally high water tables and significantly lower bearing capacity than originally assumed. Identifying this critical misclassification proactively saved the Kentucky Transportation Cabinet an estimated $3.2 million. This figure accounts for potential redesigns of the foundation from shallow footings to deep piling, additional dewatering costs during construction, and the substantial expense of managing unforeseen soil instability. More importantly, it averted a potential foundation failure that could have delayed the entire project by over a year, incurring liquidated damages, and compromised the long-term structural integrity and safety of a major transportation artery.
In a commercial development near Vancouver, Washington, a prominent retail park faced significant delays and cost overruns, illustrating the severe consequences of unaddressed drainage variability. The initial site plan, based on SSURGO map units indicating predominantly 'moderately well drained' `Olympia` series soils, failed to account for localized pockets of 'poorly drained' `Haploxerolls` in subtle depressions and swales that were too small to delineate at the original mapping scale. These areas, though individually small, became persistent wetlands during the rainy season, collecting standing water that impeded construction progress and violated local stormwater regulations. The developer was forced to implement extensive and costly dewatering operations, expand stormwater retention pond capacities beyond initial designs, and undergo a protracted re-permitting process to address the unforeseen wetland conditions. This reactive approach incurred an additional $1.8 million in unforeseen expenses, including equipment downtime, labor stand-by costs, and regulatory fines, alongside a six-month delay to the project completion. Had terrain derivatives been incorporated during early due diligence, these critical drainage patterns would have been identified, allowing for optimal site layout, proactive engineering solutions such as targeted fill and drainage systems, and avoidance of both environmental non-compliance and substantial financial penalties.
A third example highlights the economic impact on agricultural operations, specifically in the Central Valley of California. A large-scale almond grower planned a new orchard on what SSURGO mapped as largely 'well-drained' `San Joaquin` series soils, renowned for their productivity. However, a detailed terrain analysis using LiDAR-derived micro-topography revealed subtle, linear depressions that indicated 'somewhat poorly drained' `Corning` series soils, prone to seasonal waterlogging. While the overall map unit was well-drained, these localized inclusions, covering approximately 15% of the parcel, presented a significant risk. Planting almonds in poorly drained conditions leads to root rot, reduced yields, and premature tree mortality, potentially incurring losses of $20,000 to $30,000 per acre over the lifespan of the orchard. By identifying these problematic areas pre-planting, the grower was able to adjust irrigation and drainage strategies for these specific zones, or select alternative, water-tolerant rootstocks, thereby protecting an investment that could easily exceed $15,000 per acre for initial establishment costs alone and ensuring long-term orchard health and profitability. This proactive data-driven decision prevented millions of dollars in crop losses over the orchard's 25-year productive life.
The practical application of terrain derivatives begins with the acquisition and meticulous processing of high-resolution Digital Elevation Models (DEMs). While various sources exist, LiDAR data has emerged as the gold standard due to its unparalleled accuracy and ability to penetrate vegetation, yielding a true bare-earth surface model. LiDAR point clouds, often comprising dozens of points per square meter, undergo rigorous filtering algorithms to remove non-ground features such as trees, buildings, and power lines. This step is key for isolating the topographic signal. The resulting bare-earth point cloud is then interpolated into a continuous raster DEM, where each cell represents an elevation value. The resolution of this DEM, typically 1 to 5 meters for most operational applications, directly governs the granularity of the derived terrain attributes. From this foundational DEM, various geospatial software platforms (e.g., ArcGIS, QGIS, SAGA GIS) compute the full suite of terrain derivatives: basic metrics like slope gradient (the steepness of the terrain) and aspect (the direction a slope faces) are calculated using neighborhood analysis. More complex derivatives, such as profile curvature (the rate of change of slope along the steepest path), plan curvature (the rate of change of aspect), and the Topographic Wetness Index, require more sophisticated algorithms involving hydrological modeling that tracks potential water flow paths across the landscape. Each derivative offers a unique lens through which to understand the topographic control on soil properties.
Integrating these continuous terrain derivative surfaces with existing soil data, such as SSURGO, forms the analytical core of modern digital soil mapping. The `component` table within SSURGO is central to this process, holding the `drainagecl` (drainage class) attribute for each soil component. To build strong predictive models, researchers meticulously spatially join point observations (e.g., KSSL pedons, high-density field validation points) with the underlying terrain derivative rasters, extracting the TWI, curvature values, slope, and aspect at each precise observation point. These points, with their associated ground-truth drainage class and a complete set of terrain attributes, become the invaluable training data for machine learning algorithms like random forest. The model then learns the complex, often non-linear and interactive, relationships between various topographic factors and observed soil drainage. Once trained, the model can predict drainage class for every pixel across the entire landscape, generating a continuous, high-resolution map of soil drainage that refines and often significantly corrects the polygon-based SSURGO delineations. This process is essentially taking scattered, precise field observations and using the continuous environmental signal of topography to interpolate and extrapolate soil conditions across vast areas with unprecedented detail.
For professionals seeking to utilize this data, Soil Data Access (SDA) provides the programmatic interface to the SSURGO database, allowing for targeted queries of soil properties. To access standard SSURGO drainage class information, one would primarily query the `component` table. For example, a basic SQL query to retrieve drainage class for all components within a specific `areasymbol` (e.g., 'CA600' for a California county) would involve joining `component` to `mapunit` and `legend` tables using `mukey` and `lkey` as join keys: ```sql SELECT l.areasymbol, mu.mukey, mu.muname, co.compname, co.drainagecl, co.comppct_r AS component_percent FROM legend AS l JOIN mapunit AS mu ON l.lkey = mu.lkey JOIN component AS co ON mu.mukey = co.mukey WHERE l.areasymbol = 'CA600' AND co.comppct_r > 50; -- Focusing on dominant components ``` This query retrieves the standard SSURGO drainage class for dominant components. To contextualize this with terrain, one would overlay the resulting map unit polygons with independently derived terrain derivative rasters in a GIS environment, or directly integrate terrain attributes into a DSM model using these SSURGO components as reference points for training and validation. Lab10YR.com automates many of these complex geospatial operations, providing integrated visualizations and refined interpretations of soil drainage class that incorporate advanced terrain analytics. Our platform goes beyond merely displaying SSURGO; it contextualizes it with the predictive power of terrain derivatives, identifying areas where traditional soil boundaries may oversimplify complex hydrogeological realities, thus offering a more reliable foundation for critical land management decisions.
The confidence in these terrain-derived soil maps is established through rigorous validation protocols, essential for ensuring their reliability in real-world applications. Cross-validation techniques are commonly employed, where a portion of the field observation data (e.g., KSSL pedons, independent field checks) is strategically withheld from model training. This unseen data is then used to independently assess the model's predictive accuracy against ground truth. Key performance metrics include overall accuracy (the percentage of correctly classified pixels), Kappa statistics (which account for chance agreement), and producer's and user's accuracy for each individual drainage class. Furthermore, comparing these DSM-derived maps against the legacy SSURGO maps, particularly in areas of known topographic complexity or where discrepancies are suspected, consistently demonstrates the superior spatial resolution and often higher overall accuracy of the terrain derivative approach. This complete validation process ensures that the refined drainage class interpretations provided by Lab10YR are not only visually compelling but are also statistically strong and scientifically defensible, offering a more precise and reliable foundation for critical decision-making in sectors ranging from environmental assessment to infrastructure development and precision agriculture. The rigor of this validation is what transforms raw data into actionable intelligence.
The evolution from broad-brush soil mapping to high-resolution digital soil models, driven by the analytical power of terrain derivatives, represents a profound major shift in our understanding of the subsurface. It is a fundamental acknowledgment that the land surface profoundly dictates the soil below, often at scales far finer than conventional methods could capture. For professionals across engineering, environmental management, land development, and agriculture, embracing these advanced techniques is no longer an option but an imperative for mitigating risk, optimizing resource allocation, and ensuring the long-term resilience of our built and natural environments. The ability to precisely predict soil drainage class, even in the most complex terrains, offers a competitive edge and a safeguard against unforeseen challenges. By integrating these cutting-edge insights with existing soil data, we open up a new era of proactive decision-making, where the terrain's story, when read with modern tools, is undeniably more precise, economically impactful, and environmentally responsible. The future of soil intelligence lies in using the silent, yet powerful, language of topography.