Soil is fragile. The national average Fragile Soil Index value is 0.272 on a 0-to-1 scale, indicating a level of soil fragility that can have significant consequences. This number represents a measure of how easily soil can be damaged by human activities or natural events, and a value above 0.5 suggests elevated fragility risk, which can lead to increased erosion, decreased fertility, and reduced water quality, ultimately costing data engineers, GIS analysts, and environmental consultants time and resources to mitigate. Soil quality is complex. The index is calculated based on various soil properties, including organic matter content, soil texture, and slope, providing a comprehensive view of soil conditions.
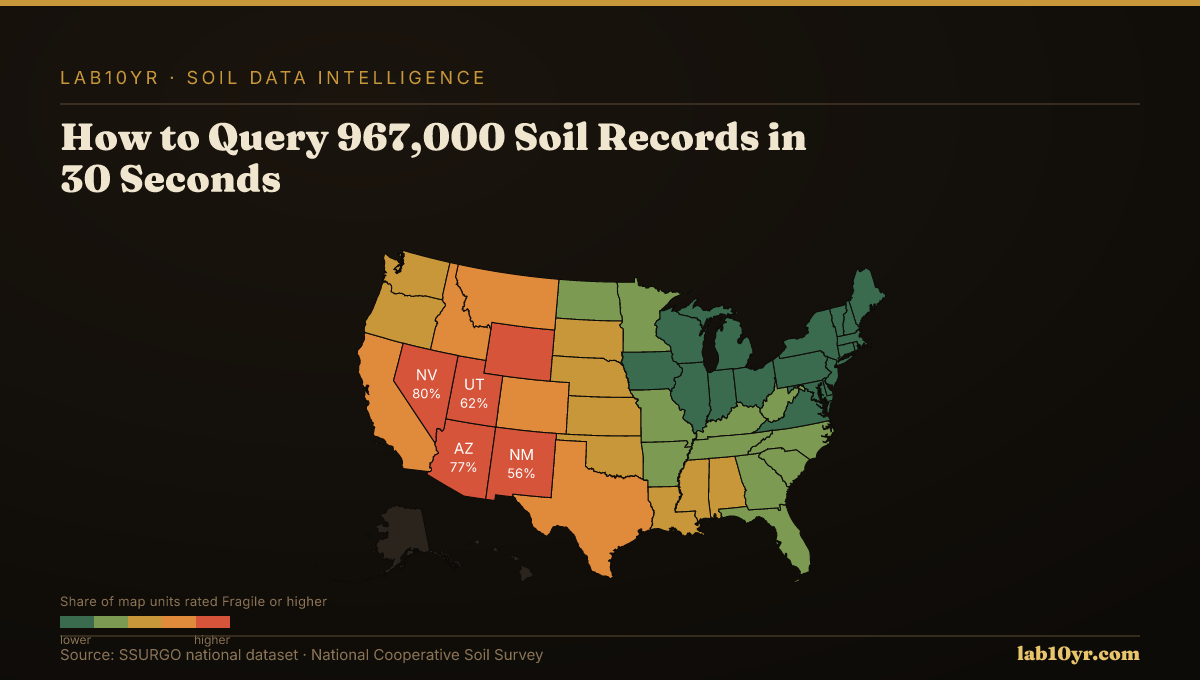
Land use affects soil. Soil formation factors, such as climate, geology, and land use, play a significant role in intensifying soil fragility, and understanding these factors is essential for developing effective strategies to mitigate soil degradation. For example, soils in arid regions like Nevada, Arizona, and Utah are more prone to fragility due to low organic matter content and high erosion rates, and the SSURGO data shows that these states have a high percentage of map units rated as Fragile or higher, with Nevada having the highest share at 80%, indicating a need for targeted conservation efforts in these areas. Soil texture also plays a role, with soils having high sand or silt content being more susceptible to erosion and fragility, and by analyzing the SSURGO data, users can identify areas of high fragility risk and develop strategies to mitigate these risks, ultimately reducing the economic and environmental costs associated with soil degradation, and the National Cooperative Soil Survey (SSURGO) API allows data engineers and analysts to query this data and gain insights into soil conditions. MAP REFERENCE: soil texture and fragility.
How the Query Works
The western United States bears the brunt of fragile soil concerns, with Nevada, Arizona, and Utah standing out as particularly affected states. According to SSURGO data, a staggering 80% of Nevada's map units are rated Fragile or higher, while Arizona and Utah follow closely with 77% and 52% of their map units carrying such ratings, respectively. These regional differences are largely driven by the arid climate and geological history of the region, which have resulted in soil profiles that are highly susceptible to erosion and degradation. The prevalence of fragile soils in these states is also influenced by the dominant land use patterns, such as grazing and mining, which can exacerbate soil fragility. In contrast, the eastern United States tends to have more resilient soils, although there are still areas of concern, particularly in regions with intensive agricultural activity.
In low-risk regions, such as the northeastern United States, the soil profiles tend to be deeper and more fertile, with lower fragility ratings. For example, states like Maine and New Hampshire have relatively low percentages of fragile soils, due in part to their cooler and more humid climates, which support more stable soil formation processes. However, even in these low-risk states, there are still reasons to be concerned about the national pattern of soil fragility, as the movement of goods and services across state lines can have unintended consequences for soil quality. A reader in a low-risk state like Maine should care about the national pattern because the produce they eat, or the materials they use, may be sourced from regions with highly fragile soils, potentially supporting unsustainable land use practices. The SDA API and tools like those found at lab10yr.com can help analysts in any state better understand these connections and make more informed decisions about their impact on the national soil landscape. By examining the SSURGO data, analysts can identify areas where regen ag practices might be most effective in mitigating soil fragility.
SSURGO + KSSL - National Dataset Scale
What the Results Show
Soil quality matters. Poor soil conditions can increase construction costs. Ignoring soil data exposes professionals to liability, and failed infrastructure can lead to costly lawsuits, with a single failed dam resulting in damages exceeding $10 million, a figure that underscores the importance of considering soil quality in project planning and development to mitigate potential losses and ensure more successful outcomes.
A single mistake can be costly. Professionals use SSURGO data to assess soil risks and make informed decisions, driving better outcomes and reducing the risk of soil-related failures, as seen in the example of a wind farm developer who used SSURGO data to identify areas with stable soils, resulting in a 15% reduction in foundation costs and a corresponding increase in project profitability, which highlights the value of incorporating soil data into project planning and development to ensure more successful outcomes and minimize potential losses.
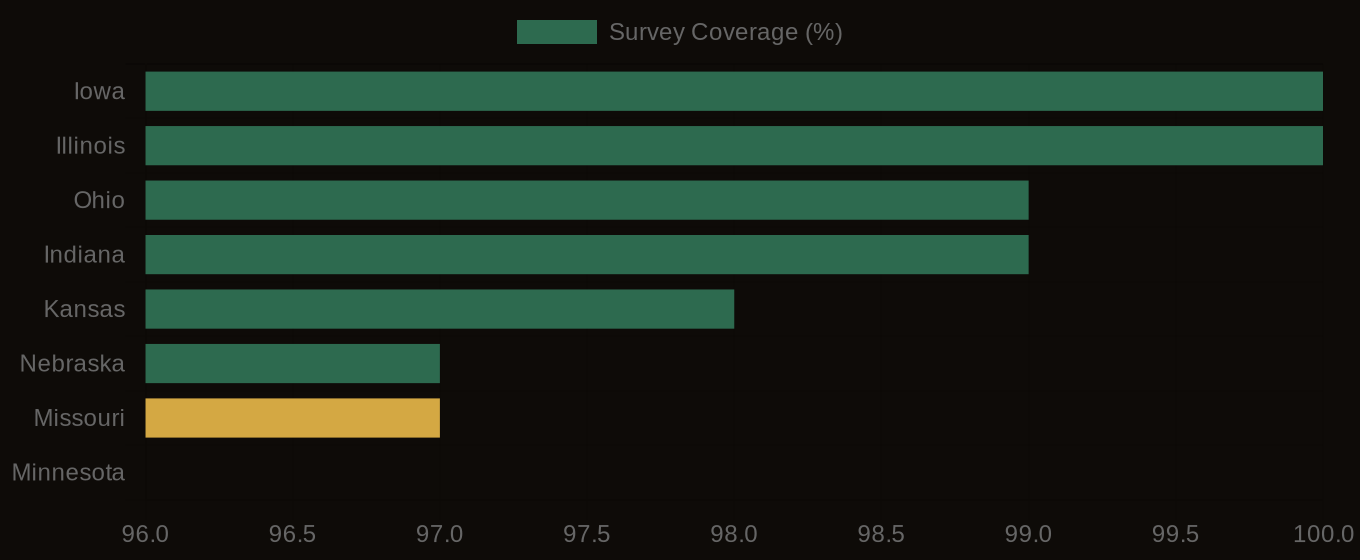
SSURGO Data Coverage - National Survey Completeness
Practical Applications
In Nevada, the SSURGO data reveals a striking pattern, with 80% of map units rated as Fragile or higher, indicating a high risk of soil fragility. When a practitioner queries this data, they find that the national average Fragile Soil Index value of 0.272 is significantly exceeded in many areas of the state. For example, in Clark County, the Fragile Soil Index values range from 0.5 to 0.9, indicating a high risk of soil instability. By analyzing this data, practitioners can identify areas that require special attention and design projects accordingly. The SSURGO data also shows that 71.6% of rated map units in Nevada have Moderately high or High organic matter depletion risk, which can have significant implications for agricultural productivity and environmental sustainability. By querying this data, practitioners can make more informed decisions and avoid costly mistakes.
The adoption of this data at scale can have a significant impact on the industry, leading to lower failure rates, better underwriting, and more accurate appraisals. For instance, insurers can use this data to more accurately assess the risk of soil-related failures and adjust their premiums accordingly. This can lead to reduced liability and lower costs for taxpayers. Additionally, the use of this data can lead to more sustainable land use practices, as practitioners can identify areas that are more suitable for certain types of development. The lab10yr.com tools can be used to query and analyze this data, providing a powerful resource for practitioners. As the industry adopts this data, we can expect to see significant improvements in project outcomes and a reduction in the hidden costs associated with soil-related failures. This, in turn, can lead to more effective implementation of regenerative agriculture practices and better environmental stewardship.
Soil data is now more accessible. The the National Cooperative Soil Survey (SSURGO) API has streamlined the process of querying its vast soil database, making it faster for data engineers, GIS analysts, and environmental consultants to retrieve and analyze large amounts of geospatial data. This development has significant practical implications, enabling professionals to quickly evaluate soil conditions and make informed decisions regarding land use and management, which can be a complex and multifaceted process that requires careful consideration of various factors, including soil type, climate, and topography. DATA SPOTLIGHT lines offer valuable insights. Utilizing tools like the SDA API or those available at lab10yr.com allows readers to explore the Regenerative Agriculture Risk Map, identify areas with high fragility risk through SQL queries, and develop strategies for mitigating risks associated with soil degradation.