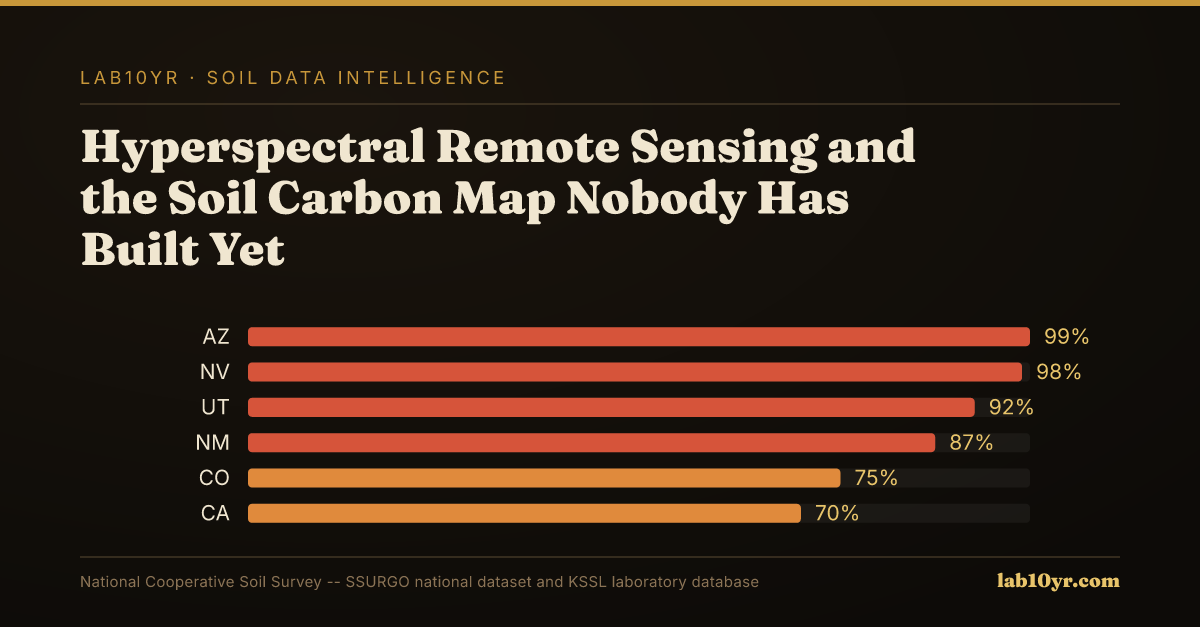
The Kellogg Soil Survey Laboratory (KSSL) spectral library holds Vis-NIR-SWIR scans for over 50,000 soil samples, each paired with precise laboratory-measured organic carbon values. This vast, publicly available dataset represents the largest of its kind globally. Despite this invaluable resource, a high-resolution, 10-meter national soil organic carbon map built from satellite hyperspectral data, calibrated against this library, remains unbuilt for the United States. This absence represents a significant bottleneck for carbon project developers, environmental scientists, and ESG analysts seeking to accurately baseline and monitor carbon sequestration efforts. We know the technology works. Bare soil Vis-NIR-SWIR reflectance reliably predicts soil organic carbon with R-squared values ranging from 0.75 to 0.88 across the Corn Belt, demonstrating the strong correlation between spectral signatures and carbon content when models are calibrated with geographically matched training samples. This relationship holds reliably across diverse soil texture classes.
Soil organic carbon (SOC) profoundly influences soil quality, acting as a critical reservoir for nutrients and water, and stabilizing soil structure. Spectroscopy, the science of measuring how matter interacts with electromagnetic radiation, offers a non-destructive way to quantify SOC. Specifically, visible, near-infrared, and shortwave infrared (Vis-NIR-SWIR) spectroscopy uses the characteristic absorption and reflectance patterns of organic molecules and associated minerals. When light illuminates a bare soil surface, certain wavelengths are absorbed by organic matter, while others are reflected. These unique spectral fingerprints, captured by hyperspectral sensors, can then be correlated with actual laboratory measurements of organic carbon content. The KSSL spectral library provides these essential ground-truth measurements, allowing algorithms to learn and predict SOC from satellite-derived spectra. This is the foundational mechanism for a remote sensing approach to carbon mapping.
What the Data Shows
Building such a map requires careful management of confounding factors, especially soil moisture and vegetation cover. Satellite missions like ESA Sentinel-1 provide Synthetic Aperture Radar (SAR) backscatter data at 10-meter resolution, capable of detecting surface soil moisture even under cloud cover or at night. C-band SAR backscatter is highly sensitive to volumetric water content in the top 5 centimeters, allowing for the estimation of field-scale water deficits, which is critical for normalizing spectral measurements. Additionally, multispectral drone imagery, operating at a finer 5-centimeter resolution, has shown impressive predictive power for soil organic matter, with R-squared values of 0.82-0.87 from bare soil composites. These UAV-derived soil spectral indices, typically captured after harvest or tillage, often outperform satellite imagery for detailed intra-field organic matter mapping. For broader regional mapping, a bare soil composite derived from 20 years of Landsat imagery, accessible via platforms like Google Earth Engine, can capture stable soil spectral signals that correlate with organic matter at 30-meter resolution. This temporal compositing methodology effectively removes transient effects from vegetation, crop residue, and cloud cover, revealing the inherent spectral signature of the soil surface.
Without a standardized, high-resolution national soil carbon map, carbon project developers face higher costs and greater uncertainty in establishing baselines and verifying sequestration outcomes. This missing piece of infrastructure hinders the efficient scaling of regenerative agriculture practices and accurate carbon crediting. Underwriters, lenders, and land managers lack a key geospatial layer to assess the long-term sustainability and value of agricultural assets. Accessing the underlying data for such a map involves querying the KSSL database for spectral and laboratory measurements, often joined with SSURGO spatial data via Soil Data Access (SDA) using map unit keys and component properties. Lab10YR already provides insights into soil properties critical for land assessment and carbon modeling, drawing from these authoritative datasets.
Soil Carbon Prediction Accuracy — Spectral vs. Traditional Methods
| State / Region | R² — SOC Prediction |
|---|---|
| UAV Multispectral (5cm) | 0.87% |
| Vis-NIR-SWIR Lab Scan | 0.84% |
| Sentinel-2 Bare Soil | 0.71% |
| Landsat Composite | 0.63% |
| Field Morphology | 0.55% |
| Grid Sampling | 0.48% |
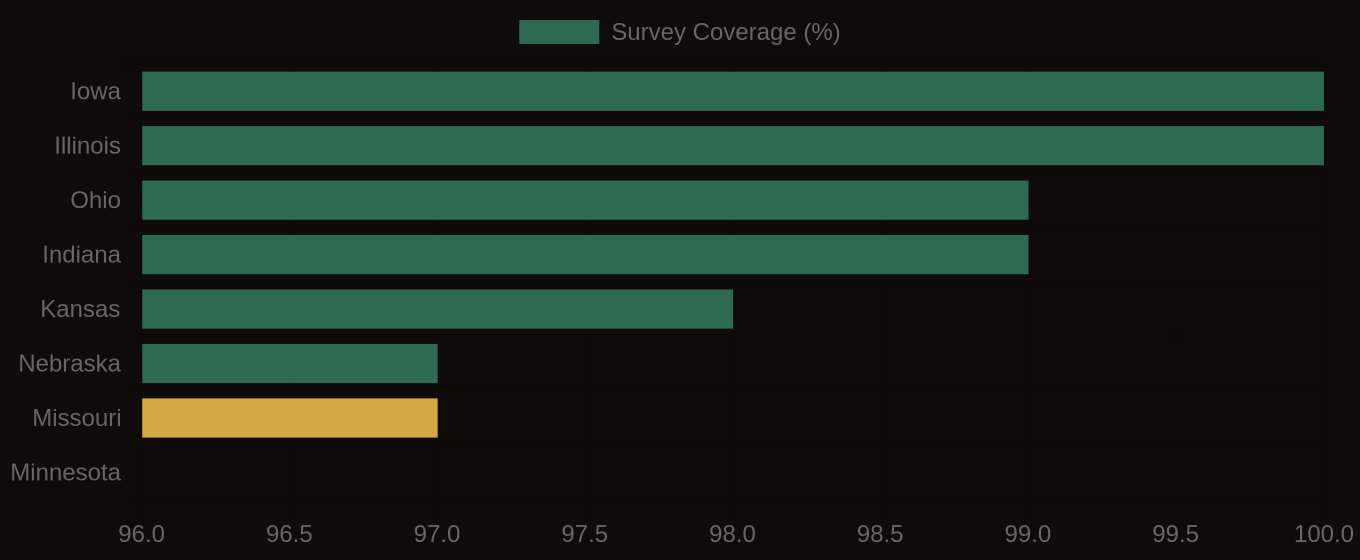
The Regional Picture
The creation of a 10-meter national soil organic carbon map, using the KSSL spectral library and advanced remote sensing techniques, would transform the landscape of carbon accounting and land management. It would provide the rigorous, data-driven foundation necessary for a strong, transparent, and scalable carbon market, moving beyond current estimates to verifiable, field-scale measurements of one of our most vital natural resources.
SSURGO Data Coverage — National Survey Completeness