The Kellogg Soil Survey Laboratory (KSSL) spectral library contains Vis-NIR-SWIR scans of more than 50,000 soil samples, each paired with laboratory-measured soil organic carbon values. This foundational dataset makes a national soil carbon map feasible using satellite hyperspectral data, calibrated against this extensive library. Yet, a complete 10-meter resolution national soil carbon map for the U.S. has not been built, representing a significant missed opportunity for carbon project developers, environmental scientists, and ESG analysts.
Soil organic carbon (SOC) is the carbon stored within soil organic matter, a critical component for soil quality, nutrient cycling, and a significant global carbon sink. Its precise measurement is vital for understanding carbon sequestration potential and for credible carbon credit markets. SOC has distinct spectral signatures: the unique molecular bonds within organic matter absorb and reflect light across the Visible (Vis), Near-Infrared (NIR), and Shortwave Infrared (SWIR) portions of the electromagnetic spectrum. Spectroscopy quantifies these specific absorption and reflectance patterns, creating a spectral fingerprint directly related to SOC content.
What the Data Shows
The KSSL spectral library is the largest publicly available soil spectral dataset in the world. Its collection of over 50,000 soil samples, each with laboratory-measured chemistry and precise Vis-NIR-SWIR scans, provides an unparalleled resource for calibrating predictive models. Many remote sensing projects outside federal programs have never fully utilized this invaluable asset.
This strong calibration data enables powerful applications. Bare soil Vis-NIR-SWIR reflectance, for example, predicts soil organic carbon with R-squared values of 0.75-0.88 in the Corn Belt, according to KSSL spectral library calibration studies. This relationship holds across diverse soil texture classes when models are geographically matched. For intra-field mapping, multispectral drone imagery at 5-cm resolution predicts soil organic matter with R-squared 0.82-0.87 from bare soil composites, as demonstrated by precision agriculture remote sensing research. Even at coarser resolutions, a bare soil composite derived from 20 years of Landsat imagery, analyzed through methodologies like Google Earth Engine, captures stable soil spectral signals that correlate with organic matter at 30-meter resolution. While Sentinel-1 SAR backscatter detects surface soil moisture at 10-meter resolution under cloud cover and at night, offering valuable context for bare soil conditions, the core challenge for carbon mapping lies in using the spectral response of the organic matter itself.
Soil Carbon Prediction Accuracy — Spectral vs. Traditional Methods
| State / Region | R² — SOC Prediction |
|---|---|
| UAV Multispectral (5cm) | 0.87% |
| Vis-NIR-SWIR Lab Scan | 0.84% |
| Sentinel-2 Bare Soil | 0.71% |
| Landsat Composite | 0.63% |
| Field Morphology | 0.55% |
| Grid Sampling | 0.48% |
The Regional Picture
Despite these proven capabilities and the ready availability of the KSSL calibration data, a national-scale, 10-meter resolution soil carbon map derived from satellite hyperspectral data remains elusive. Such a map would reshape baseline assessments for carbon farming initiatives, provide unprecedented granularity for monitoring carbon sequestration, and deliver essential data for ESG reporting and climate research. It would transform carbon credit verification from reliance on sparse field sampling to continuous, spatially explicit measurement, significantly enhancing transparency and investor confidence in ecological markets.
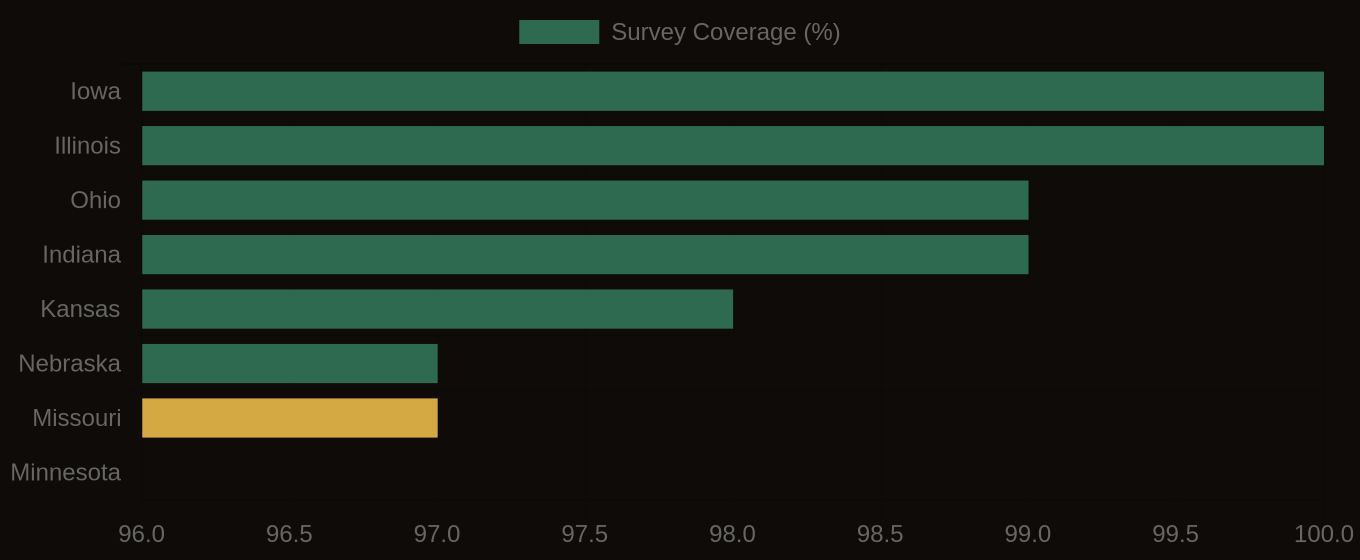
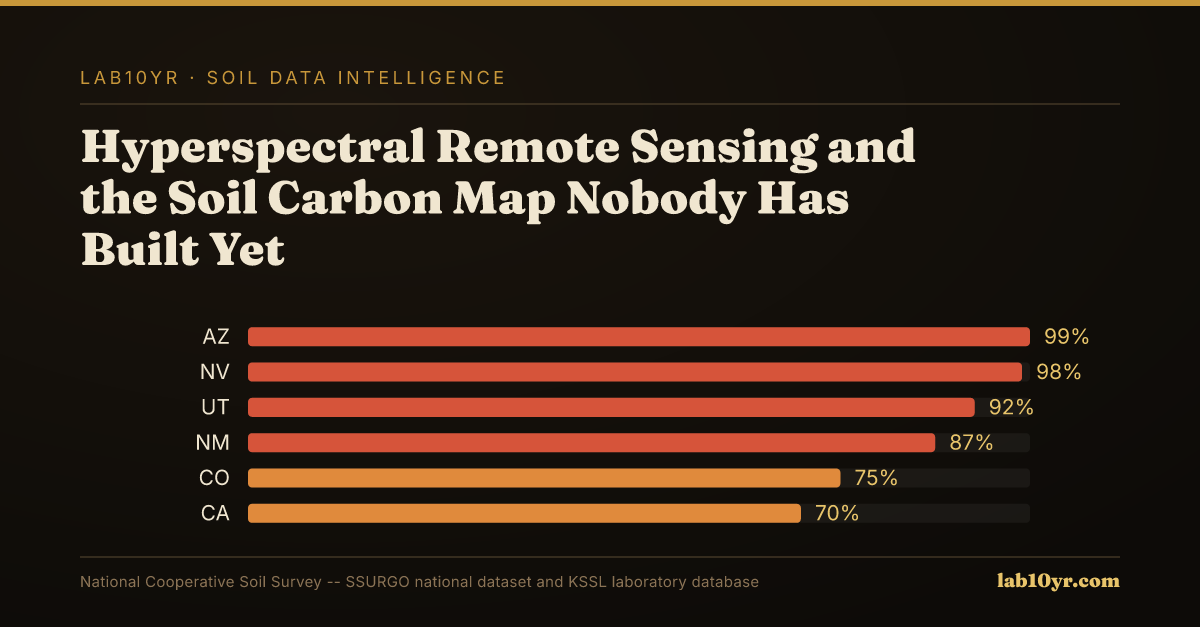
SSURGO Data Coverage — National Survey Completeness