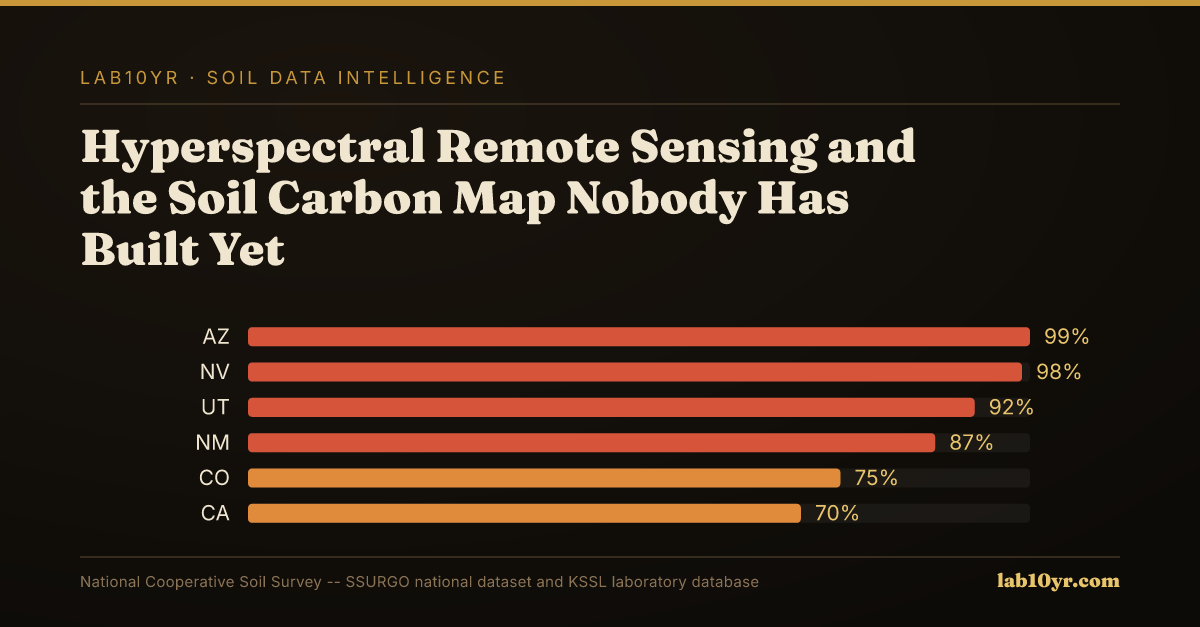
The KSSL spectral library contains Vis-NIR-SWIR scans of more than 50,000 soil samples, each matched with precise laboratory-measured organic carbon values. This vast dataset offers the foundational ground truth for a high-resolution national soil carbon map of the United States. Yet, remarkably, no such map exists at the 10-meter resolution necessary for strong carbon credit verification or targeted regenerative agriculture investments. The absence of this critical geospatial intelligence forces carbon project developers, land managers, and ESG analysts to rely on less precise methods, hindering the growth of climate-smart land stewardship and accurate carbon accounting.
Soil organic carbon (SOC) significantly influences the spectral reflectance of bare soil across the visible, near-infrared, and shortwave infrared (Vis-NIR-SWIR) portions of the electromagnetic spectrum. As SOC content increases, soil typically absorbs more light in the visible range, making it appear darker, and exhibits characteristic absorption features in the near-infrared and shortwave infrared due to organic functional groups. Spectroscopy measures how light interacts with soil, capturing these unique spectral fingerprints. The Kellogg Soil Survey Laboratory (KSSL) database houses an unparalleled collection of these spectral measurements, alongside direct chemical analyses for properties like organic matter content (recorded as `om_r` in the `chorizon` table of SSURGO), providing a strong basis for training spectral models. These KSSL samples, linked by `chkey` identifiers, represent a diverse range of soil types and environmental conditions, making them ideal for calibrating remote sensing algorithms.
What the Data Shows
Building a national map requires using this calibration potential. In the Corn Belt, for instance, bare soil Vis-NIR-SWIR reflectance has been shown to predict soil organic carbon with R-squared values ranging from 0.75 to 0.88. This strong correlation holds across various soil texture classes when models are locally calibrated. Regions like the chernozemic Mollisols of Iowa, with their deep, dark topsoils, present distinct spectral characteristics compared to, for example, the Spodosols of Florida's sandy coastal plains or the Vertisols of Texas's Blackland Prairie. Each soil series, with its unique mineralogy, moisture regime, and organic matter composition, modulates its spectral response differently, necessitating regional or soil-specific calibration strategies to achieve high accuracy.
Consider a carbon project developer in central Iowa, aiming to quantify carbon sequestration for a 10,000-acre corn and soybean operation, primarily on Tama series soils. Without a reliable 10-meter resolution baseline soil organic carbon map, they face substantial uncertainty. This uncertainty can translate into a 15-20% margin of error in carbon credit calculations, potentially devaluing a project by hundreds of thousands of dollars over a 10-year contract, impacting farmer incentives and investor confidence. The lack of precise, verifiable data creates friction in carbon markets, stifling investment in beneficial management practices.
Soil Carbon Prediction Accuracy — Spectral vs. Traditional Methods
| State / Region | R² — SOC Prediction |
|---|---|
| UAV Multispectral (5cm) | 0.87% |
| Vis-NIR-SWIR Lab Scan | 0.84% |
| Sentinel-2 Bare Soil | 0.71% |
| Landsat Composite | 0.63% |
| Field Morphology | 0.55% |
| Grid Sampling | 0.48% |
The Regional Picture
Elsewhere, an agricultural lender underwriting a multi-million dollar loan for a vineyard expansion in California's Central Valley, where San Joaquin series soils dominate, needs to assess long-term soil productivity and climate resilience. Current methods, often relying on coarser SSURGO `om_r` estimates or costly, infrequent field sampling, fall short. An accurate, frequently updated soil carbon map would enable the lender to better assess the collateral's inherent productivity, quantify the risk of degradation, and even offer preferential rates for operations committed to carbon-enhancing practices. Without it, they might misprice risk or overlook opportunities for sustainable financing, hindering the transition to a more resilient agricultural economy.
Constructing such a map involves integrating multiple data streams. Satellite hyperspectral data from missions like PRISMA or upcoming SBG (Surface Biology and Geology) can provide the raw spectral signatures. These are then calibrated using the KSSL spectral library, linking observed reflectance to laboratory-measured SOC. Temporal compositing of 20 years of Landsat and Sentinel-2 imagery via platforms like Google Earth Engine can create bare soil composites, removing vegetation and atmospheric noise to expose the underlying soil spectral signal. Furthermore, Sentinel-1 Synthetic Aperture Radar (SAR) data, sensitive to soil moisture in the top 5 cm, is key for normalizing spectral measurements, as soil moisture significantly impacts reflectance. Lab10YR synthesizes these disparate datasets, using SSURGO's `chorizon` table for organic matter (om_r) and texture information, and linking to KSSL data via `chkey`, to provide contextualized, actionable soil interpretations for professionals.
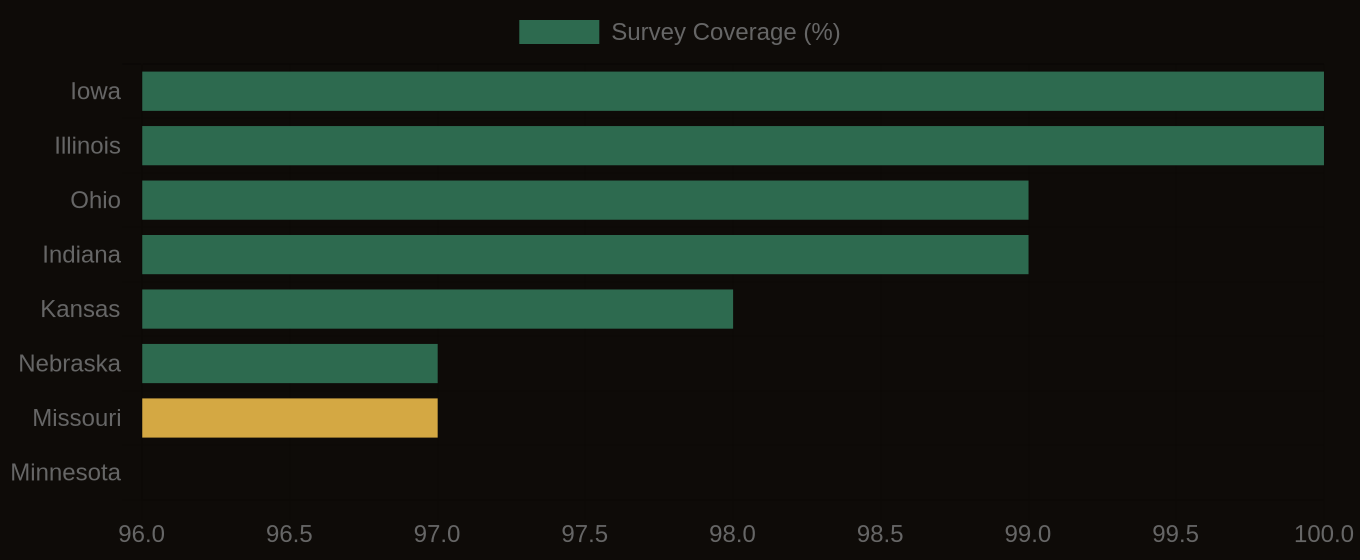
SSURGO Data Coverage — National Survey Completeness
What It Means in Practice
The absence of a high-resolution, national soil carbon map is a significant data gap for climate action and sustainable land management. By combining the vast potential of the KSSL spectral library with advanced remote sensing and strong data integration, we can build the precise, verifiable carbon intelligence needed to open up investment, incentivize regenerative practices, and accurately track progress towards climate goals.