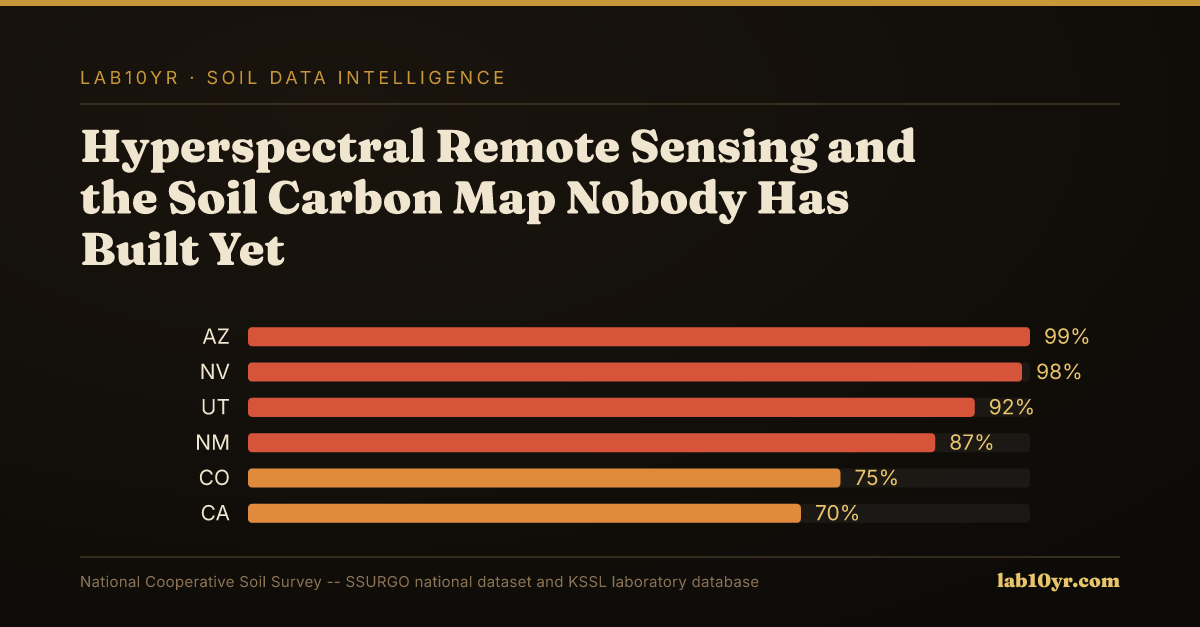
The Kellogg Soil Survey Laboratory (KSSL) spectral library holds Vis-NIR-SWIR scans for over 50,000 soil samples, each paired with precise laboratory-measured organic carbon values. This vast, publicly available dataset provides an unparalleled foundation for a national soil organic carbon map of the U.S. at 10-meter resolution, a critical resource yet to be fully realized.
Soil organic carbon (SOC) is vital for soil quality, influencing structure and water retention. Vis-NIR-SWIR spectroscopy measures unique light absorption features of soil organic matter, directly correlating with concentration. Lab analysis uses dry combustion. KSSL stores these lab values (`soc`) with spectral signatures (`chkey`), demonstrating how bare soil Vis-NIR-SWIR reflectance predicts SOC with R-squared 0.75-0.88 in the Corn Belt, given proper calibration.
What the Data Shows
For carbon project developers, a precise national map would reshape baselining and verification. In central Iowa, current sampling costs thousands per thousand acres. A 10-meter map could cut sampling costs by 70%, boosting implementation investment and potentially increasing validated carbon credit issuance.
Environmental scientists and ESG analysts would benefit from enhanced ecosystem modeling. In California's rangelands, targeted conservation and precise emission quantification could replace broad assumptions. This provides strong, verifiable data for sustainable land management, shifting from qualitative to quantitative impact.
Soil Carbon Prediction Accuracy — Spectral vs. Traditional Methods
| State / Region | R² — SOC Prediction |
|---|---|
| UAV Multispectral (5cm) | 0.87% |
| Vis-NIR-SWIR Lab Scan | 0.84% |
| Sentinel-2 Bare Soil | 0.71% |
| Landsat Composite | 0.63% |
| Field Morphology | 0.55% |
| Grid Sampling | 0.48% |
The Regional Picture
Building this map integrates satellite hyperspectral or existing multispectral/radar imagery. Decades of Landsat imagery create bare soil composites; Sentinel-1 SAR provides key all-weather soil moisture data. Calibrating these remote sensing inputs against KSSL's `chkey` and `soc` values, linked to SSURGO's `component` and `chorizon` tables for spatial context, forms the core methodology. Lab10YR interprets SSURGO and KSSL data for land-use decisions.
The scientific foundation and data exist to construct a national 10-meter resolution soil organic carbon map. This unbuilt resource represents a profound missed opportunity, poised to reshape agricultural carbon markets, climate resilience, and environmental stewardship.
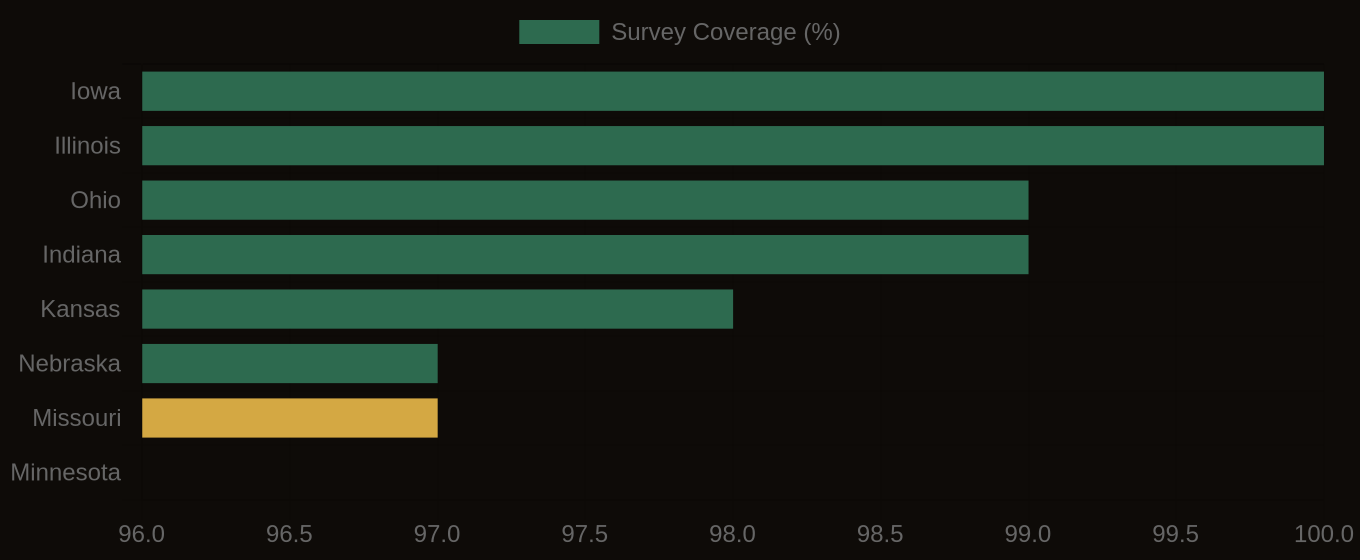
SSURGO Data Coverage — National Survey Completeness