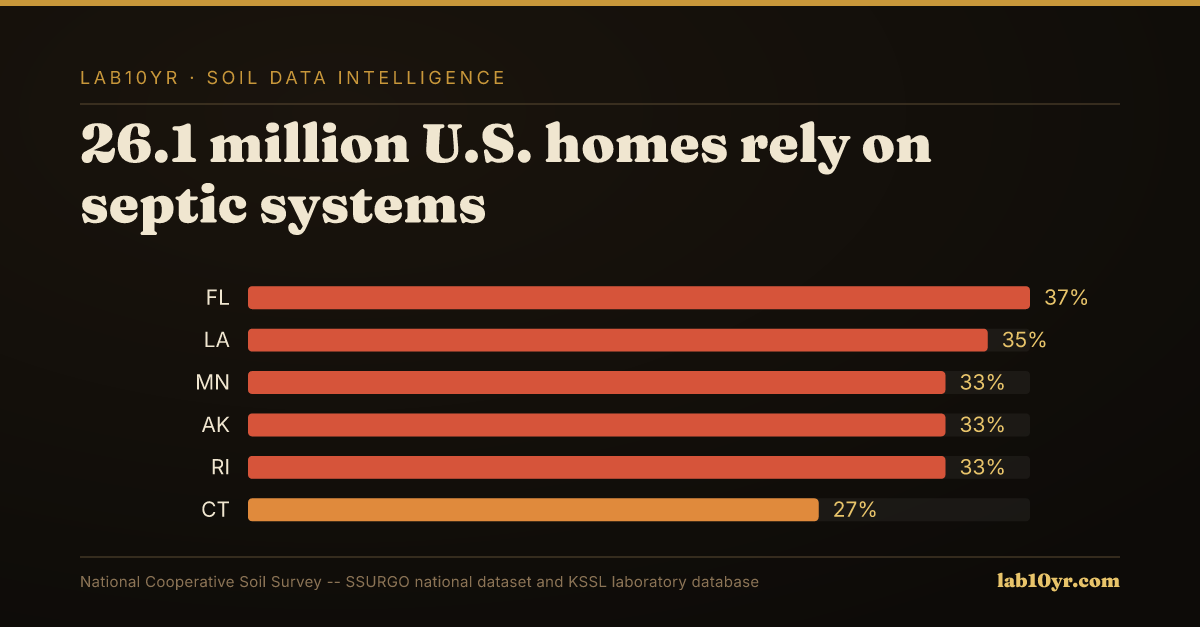
Geomorphon analysis of 1-meter LiDAR surfaces classifies landform elements like summits and footslopes with unprecedented precision. This granular understanding of slope position directly improves the assignment of soil series, critically impacting interpretations such as septic system suitability. Over 26.1 million U.S. homes rely on septic systems, comprising 21% of all housing units, making accurate siting essential. Poorly placed systems lead to costly failures and environmental hazards.
Traditional field observation delineates soil catenas by visually assessing changes in elevation and form. However, digital elevation models (DEMs) derived from LiDAR data offer an objective, repeatable method. LiDAR, or Light Detection and Ranging, uses pulsed laser light to measure ranges to the Earth's surface, creating highly detailed topographic maps. Geomorphon algorithms then process these DEMs to classify specific landform elements--summit, shoulder, backslope, footslope, toeslope--that reliably predict variations in soil drainage and organic matter content along a slope. This refinement in terrain analysis allows soil scientists to more accurately assign specific soil series to discrete landscape positions, capturing subtle but significant differences in soil properties.
What the Data Shows
This enhanced precision directly translates to more reliable SSURGO "Sewage Disposal" interpretations, which rate conventional septic system suitability based on percolation rates, depth to water table, and restrictive layers. Nationally, soils rated 'Severe' or 'Very Severe' for septic systems cover 42% of U.S. rural land area. These severe ratings reflect conditions like excessively slow percolation or high water tables that prevent adequate effluent treatment. Improved soil series mapping helps identify these problematic zones more precisely, preventing costly failures. Failed septic systems can cost $3,000-$30,000 to repair or replace, a significant financial burden that accurate pre-siting assessment can avoid.
Clay pan soils, including Fragiudults and Argialbolls, exhibit the highest septic failure rates nationally due to seasonally perched water tables above dense clay horizons, overwhelming absorption fields within 5-15 years. In Georgia, for instance, 61% of rural map units are rated Severe for conventional septic systems, largely due to high clay subsoils with low saturated hydraulic conductivity in series like Cecil, Madison, and Appling on the Piedmont. By integrating LiDAR-derived slope position into soil mapping, professionals using SSURGO data can access interpretations that better reflect the true site conditions, leading to more informed planning and reduced environmental and economic risk.
Terrain Derivative Accuracy — Predicting SSURGO Drainage Class
| State / Region | Accuracy (%) |
|---|---|
| Random Forest (all derivatives) | 83% |
| Topographic Wetness Index | 79% |
| Geomorphon + TWI | 76% |
| Slope Position Index | 68% |
| Profile Curvature | 62% |
| Slope Angle Only | 44% |
| Legacy SSURGO Polygon | 71% |
The Regional Picture
Fragile Soil Index Across America