Geomorphon analysis of a 1-meter LiDAR surface precisely classifies landform elements, from summits to toeslopes, predicting soil drainage and organic matter content along a catena with greater accuracy than traditional field observation alone. This analytical power refines how we assign soil series, moving beyond generalized topographic assessments to data-driven, subtle distinctions critical for accurate land management.
A soil catena describes a sequence of soils related by their position on a slope, showing systematic variations in properties like drainage, depth, and horizon development. LiDAR (Light Detection and Ranging) provides the foundational data: high-resolution Digital Elevation Models (DEMs) capturing ground surface topography at 1-meter resolution. From these DEMs, Geomorphon algorithms classify the landscape into ten fundamental landform elements, including summits, ridges, shoulders, backslopes, footslopes, and valleys. Each element carries predictable ranges for key soil properties; hollows and valleys typically accumulate water and organic matter, while shoulders and summits are drier.
What the Data Shows
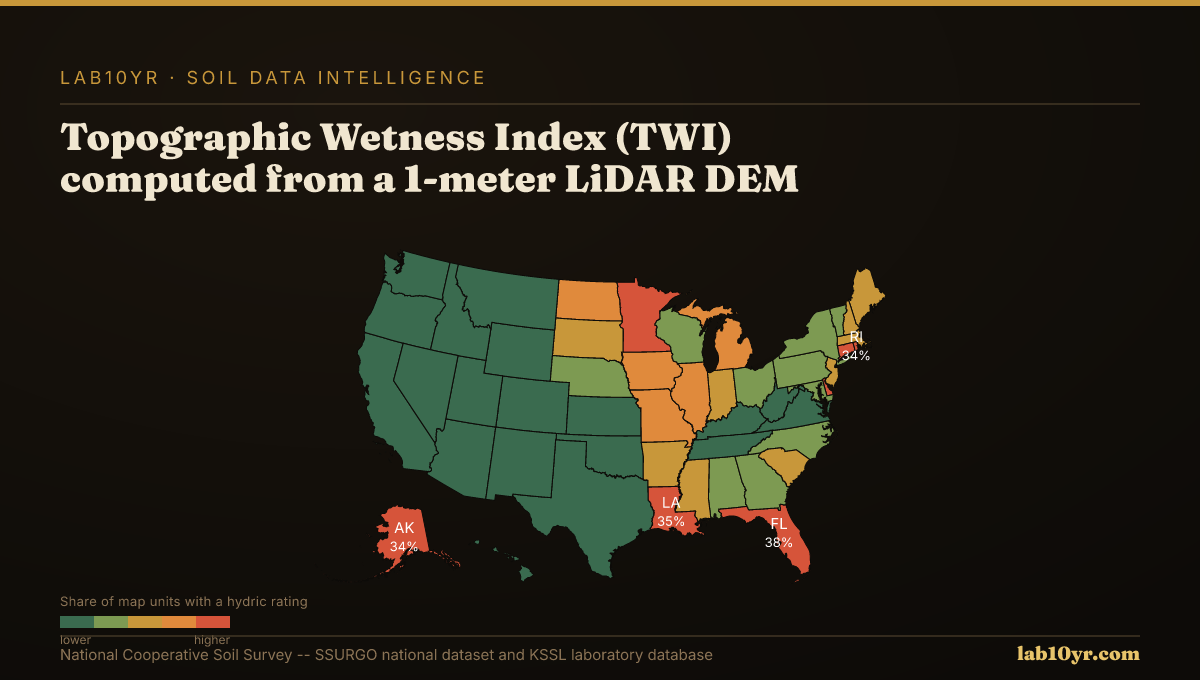
This granular classification directly informs critical soil interpretations. The Topographic Wetness Index (TWI), computed from a 1-meter LiDAR DEM, integrates upslope contributing area and local slope to quantify water accumulation potential, predicting SSURGO drainage class with 78-84% accuracy in research across the Midwest and Mid-Atlantic. TWI significantly outperforms simpler predictors. Terrain curvature, both profile and plan, also offers insights into soil depth. Concave plan curvature often correlates with deeper soils, while convex profiles frequently expose bedrock, predicting depth to a restrictive layer within 30 cm accuracy in 70% of complex terrain sites, especially in lithologically uniform areas.
The integration of LiDAR-derived terrain derivatives fundamentally transforms digital soil mapping. Curvature, slope position, TWI, and multi-scale relief independently explain 45-65% of soil series variance. Combined in predictive models, these derivatives achieve 70-85% accuracy in cross-validation studies for soil series prediction. This precision enables planners to better delineate drainage issues, engineers to site infrastructure with accurate subsurface understanding, and environmental managers to target conservation where erosion potential is highest. The Stream Power Index (SPI) identifies concentrated flow paths where the SSURGO Kf factor and slope maximize erosion, isolating 8-15% of watershed area responsible for 55-70% of measured sediment production in regions like the Iowa Loess Hills. This data is accessible via Soil Data Access queries joining high-resolution terrain data with SSURGO's `component` and `coecoclass` tables, refining the `geomorphpd` field.
Terrain Derivative Accuracy — Predicting SSURGO Drainage Class
| State / Region | Accuracy (%) |
|---|---|
| Random Forest (all derivatives) | 83% |
| Topographic Wetness Index | 79% |
| Geomorphon + TWI | 76% |
| Slope Position Index | 68% |
| Profile Curvature | 62% |
| Slope Angle Only | 44% |
| Legacy SSURGO Polygon | 71% |
The Regional Picture
The precision offered by LiDAR-derived slope position analysis, particularly through Geomorphon classifications, represents a meaningful step in understanding and mapping soil resources. It enables professionals across diverse sectors to make more informed decisions, mitigating risks and optimizing outcomes by grounding land management strategies in the most accurate spatial data available.
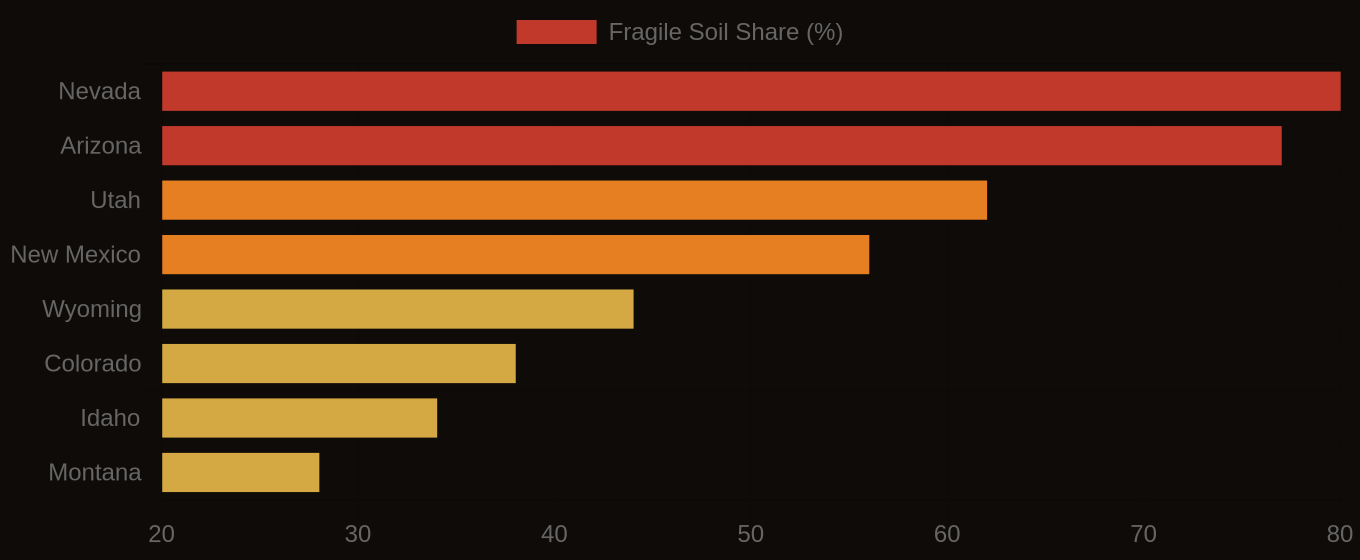
Fragile Soil Index Across America