A bare soil multispectral image at 5-centimeter resolution predicts soil organic matter across a central Iowa field with an R-squared above 0.85. The laboratory sample it would replace costs roughly 25 dollars per point and comes back in two weeks. The drone flight costs about 3 dollars an acre and finishes before lunch. That gap, between two points sent to a lab per 40 acres and two million pixels of calibrated reflectance, is why precision agriculture is quietly rebuilding how organic matter gets mapped. The catch is that the image measures light, not carbon, and the difference between those two things is where most projects fail.
Start with the physics of why bare soil reflectance carries information about organic matter at all. Soil organic matter is the decomposed and partly decomposed plant and microbial material that accumulates in the topsoil. The dark, humified fraction of it acts as a chromophore, a substance that absorbs light broadly across the visible spectrum, from roughly 400 to 700 nanometers. Pile more organic matter into a horizon and the surface darkens and its reflectance drops. The relationship continues into the near infrared and shortwave infrared, where specific absorption features tie to the carbon-hydrogen and oxygen-hydrogen bonds in organic molecules and in the water and clay minerals bound up with them. A spectrometer reads those dips in reflected energy. With a calibration model trained on samples of known carbon content, those dips become a number.
What the Data Shows
This is not a new idea in the laboratory. The Kellogg Soil Survey Laboratory has been scanning soil with visible, near infrared, and shortwave infrared light for years, building a spectral library of more than 50,000 soil samples, each one matched to wet-chemistry measurements of organic carbon, texture, and cation exchange. It is the largest publicly available soil spectral dataset in the world, and most remote sensing projects outside federal programs have never touched it. Calibrated against that library, bare soil Vis-NIR-SWIR reflectance predicts soil organic carbon in the Corn Belt with an R-squared between 0.75 and 0.88. The relationship holds across silt loams, silty clay loams, and sandy loams, but only when the model is trained on geographically matched samples. That last condition is the whole game.
What a drone adds is not better physics but better geometry. A multispectral sensor on an unmanned aircraft typically reads four to ten spectral bands at a few centimeters per pixel, flying low and capturing the field in two hours. Operators fly these missions after harvest or after tillage, when the soil surface is exposed and crop residue is at a minimum. From a stack of those flights they build a bare soil composite, an image assembled only from pixels where soil, not vegetation, dominates the signal. The screening tool is usually NDVI, the normalized difference vegetation index, which contrasts red and near infrared reflectance to detect chlorophyll. Living vegetation has a high NDVI; bare soil has a low one. By keeping only the low-NDVI pixels and averaging across several dates, the workflow strips out green plants, drying residue, and transient shadows to expose the stable soil spectral signal underneath. Multispectral drone imagery built this way predicts soil organic matter at 5-centimeter resolution with an R-squared of 0.82 to 0.87, and for mapping the variation within a single field it beats anything a satellite can deliver.
Soil Carbon Prediction Accuracy - Spectral vs. Traditional Methods
| State / Region | R² - SOC Prediction |
|---|---|
| UAV Multispectral (5cm) | 0.87% |
| Vis-NIR-SWIR Lab Scan | 0.84% |
| Sentinel-2 Bare Soil | 0.71% |
| Landsat Composite | 0.63% |
| Field Morphology | 0.55% |
| Grid Sampling | 0.48% |
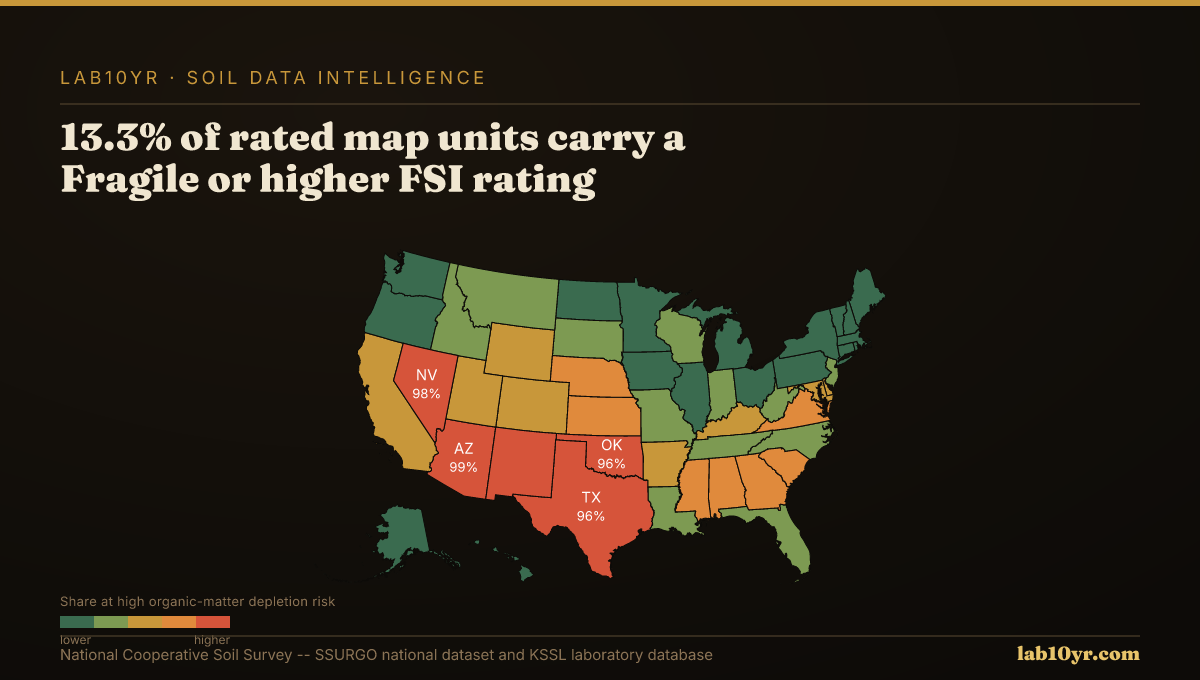
The Regional Picture
The reason it beats satellites is resolution against the size of the thing being measured. Organic matter in a Corn Belt field is not uniform. It pools in the swales and old drainageways where the Drummer and Maumee series sit, the poorly drained silty clay loams that can carry topsoil carbon two and three times the level of the eroded Clarion knobs a hundred feet away. A 30-meter Landsat pixel averages that pattern into mush. A 5-centimeter drone pixel resolves the swale from the shoulder, which is exactly the scale at which a variable-rate prescription or a soil carbon sampling plan has to operate.
None of this removes the lab. It relocates it. The reflectance-to-carbon model is only as good as the calibration samples behind it, and a model trained in the loess soils of the Tama and Muscatine series in eastern Iowa will not transfer cleanly to the glacial tills of central Minnesota or the red, iron-rich Ultisols of the southeastern Piedmont. Iron oxides redden and brighten soil in ways that mimic or mask the darkening from organic matter. Carbonates add their own absorption features. Surface moisture darkens everything and inflates apparent carbon if a field was scanned wet. This is why geographically matched training samples matter, and why the KSSL library is the asset most operators overlook: it is the reference chemistry that turns a pretty reflectance map into a defensible carbon estimate.
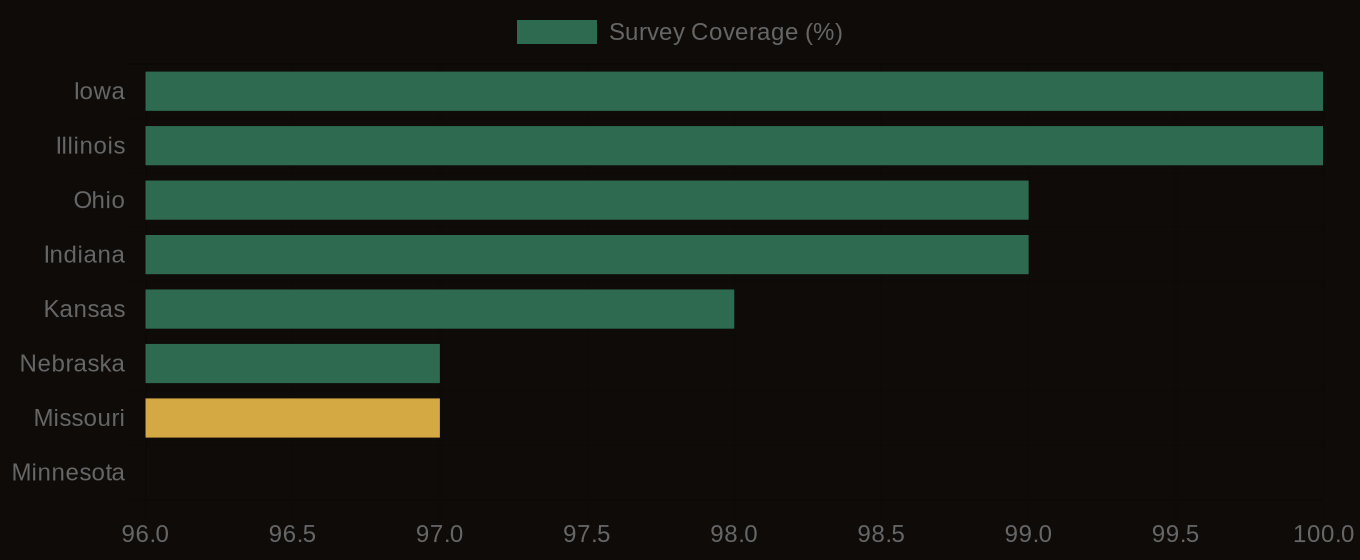
SSURGO Data Coverage - National Survey Completeness
What It Means in Practice
The stakes are sharpest in soil carbon project development, where the organic matter number is not an agronomic curiosity but the unit being sold. A carbon credit pays for a measured increase in soil organic carbon over a baseline, and registries require that baseline to be quantified with stated uncertainty. The conventional path is a stratified soil sampling campaign: pull cores on a grid, composite them, ship them to a lab, and pay per sample. On a 2,000-acre operation, a defensible baseline at one sample per 10 acres is 200 samples, two weeks of turnaround, and a five-figure bill before a single credit is verified. The wider the measured variance, the more samples a registry demands to hit a confidence threshold, and high-variance fields are common precisely where carbon opportunity is largest.
Consider a project on the Mollisols of McLean County, Illinois, the deep, dark prairie soils where the Drummer silty clay loam dominates the flats and the Catlin and Saybrook series climb the gentle rises. Organic matter there can range from below 3 percent on the eroded shoulders to above 6 percent in the depressions, all inside one quarter section. A pure grid-sampling baseline either misses that structure or pays through the nose to capture it. A better design uses a bare soil composite, drone or satellite, to map the spatial pattern of organic matter first, then places the lab cores where they resolve the most uncertainty: a few in each spectral class rather than a blind grid. The image does not replace the chemistry. It tells the chemistry where to go. Projects that sequence the work this way routinely cut sampling counts by half while tightening the uncertainty band, and a tighter band means more verified tons per acre survive the registry's discount for measurement error.
Moisture is the failure mode that ends careless projects, and it is where radar earns its place. Surface water darkens soil and steepens the very reflectance slope a carbon model reads, so a field scanned the morning after rain will read high on organic matter unless the moisture state is known. Sentinel-1 synthetic aperture radar measures this directly. Its C-band backscatter is sensitive to the volumetric water content of the top 5 centimeters of soil at 10-meter resolution, and because radar makes its own illumination, it returns that reading through cloud cover and at night when an optical sensor sees nothing. Pair that moisture field with the available water capacity stored in SSURGO, the awc_r value in the component horizon table that records how much plant-available water each horizon holds, and a manager can both correct a reflectance map for wetness and estimate a field-scale water deficit on the same date. The radar tells you the soil was wet. SSURGO tells you how wet that soil can get. Together they keep an organic matter estimate honest.
The ground truth a manager already owns lives in SSURGO and is free. Organic matter by horizon sits in the chorizon table as om_r, the representative organic matter percentage, alongside the texture and bulk density that shape the spectral response. The full national dataset spans 315,543 map units, and pulling the om_r profile for a project area through the National Cooperative Soil Survey (SSURGO) takes a single query. That survey value is a regional average for a soil series, not a field measurement, so it will never match a drone pixel exactly. Used as a sanity check it is invaluable: a reflectance model that maps a Tama silt loam at 1.5 percent organic matter where SSURGO records the series near 4 has a calibration problem, not a discovery. At lab10yr.com we assemble these SSURGO interpretations and the matched KSSL chemistry into the reference layer that imagery has to agree with, so a manager can see, county by county, what organic matter and available water capacity the survey expects before a single drone composite is trusted.
The lesson for anyone selling or buying a soil carbon number is that the drone and the lab are not competitors. The image is a fast, dense, spatial guess about light. The KSSL chemistry is a slow, sparse, expensive truth about carbon. The 5-centimeter map is worth its 3 dollars an acre only when it is tied to that truth and corrected for the moisture and mineralogy that make light a liar. Treat the reflectance as a prediction to be calibrated and a sampling plan to be optimized, not a measurement to be trusted on its own, and the economics flip in your favor: fewer cores, tighter uncertainty, and a carbon baseline that survives an auditor. The soil has been writing its organic matter in light all along. Reading it correctly is the work.