Nitrogen fertilizer costs American agriculture more than 22 billion dollars per year. The fraction that leaches into groundwater is predictable from soil texture data that already exists for every field in the country, yet most farmers have never seen the map.
Nitrate leaching occurs when soluble nitrate ions move downward through the soil profile with percolating water, beyond the plant root zone. The primary driver of this process is soil texture, which describes the relative proportions of sand, silt, and clay particles. Coarse soil textures, such as sands and loamy sands, have large pores that result in high saturated hydraulic conductivity, or Ksat, defined as the rate at which water moves through saturated soil. This high Ksat facilitates rapid water movement and, critically, rapid nitrate transport. Conversely, fine textures like clays have smaller, less connected pores, leading to low Ksat and slower water movement. This key soil property is determined through laboratory particle size analysis and estimated in the field, with representative values stored in the National Cooperative Soil Survey's SSURGO database in fields such as `chtexturegrp` for texture class and `ksat_r` for the Ksat value at the component level.
The Regional Concentration
Understanding this inherent soil characteristic is essential for precision agriculture managers, nitrogen credit buyers, and agricultural lenders. In regions like the Central Sands of Wisconsin, the Plainfield series, a deep, excessively drained soil, exemplifies high nitrate leaching potential. Here, the `chtexturegrp` field consistently reports textures like "sand" or "loamy sand," indicating minimal nitrate retention. This translates directly into higher fertilizer costs for growers, as a significant portion of applied nitrogen may never reach the crop, and contributes to groundwater contamination, impacting water quality and potentially increasing treatment expenses for municipalities.
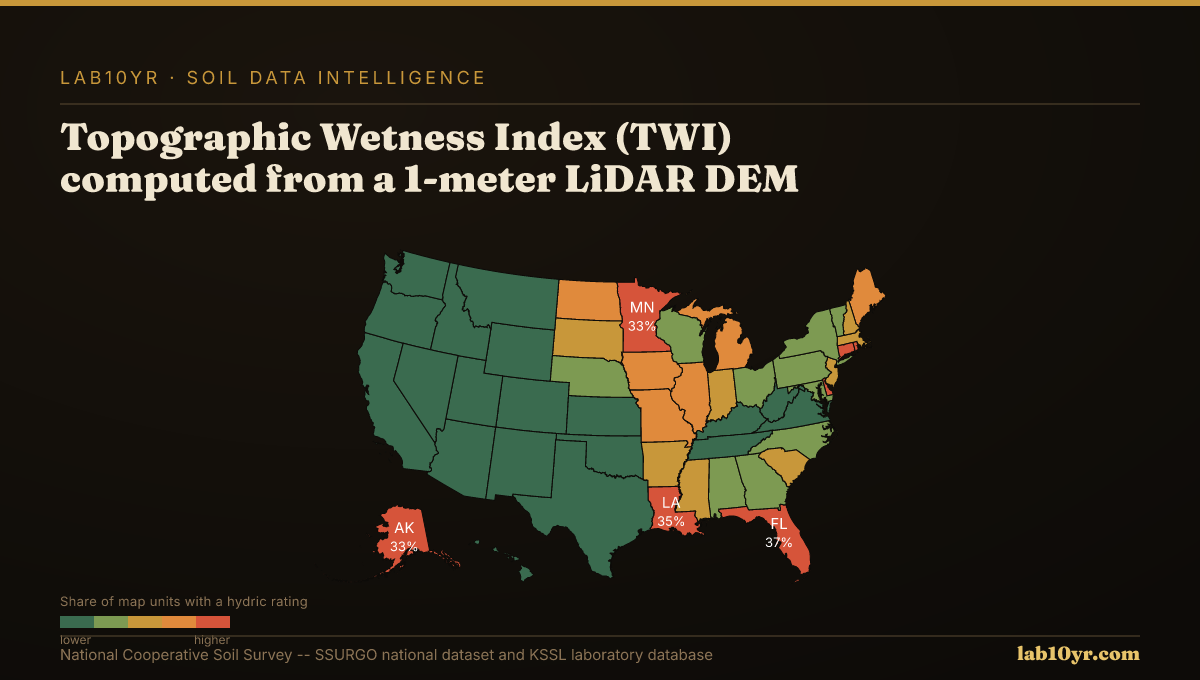
Digital soil mapping techniques, especially those using 1-meter LiDAR terrain derivatives, offer powerful refinements to these assessments. The Topographic Wetness Index (TWI), which integrates upslope contributing area and local slope to quantify water accumulation potential, predicts SSURGO drainage class with 78-84% accuracy, providing critical context for water movement pathways. Furthermore, geomorphon landform classification from LiDAR identifies distinct terrain elements, such as shoulders or footslopes, that correspond to predictable soil drainage and organic matter conditions, influencing where leaching is most likely to occur. This invaluable soil data, available nationally through Soil Data Access (SDA) by querying tables like `component` for general soil properties, `cointerp` for interpretations, and `chtexturegrp` for specific texture details, offers immediate, actionable intelligence for agricultural decision-making.
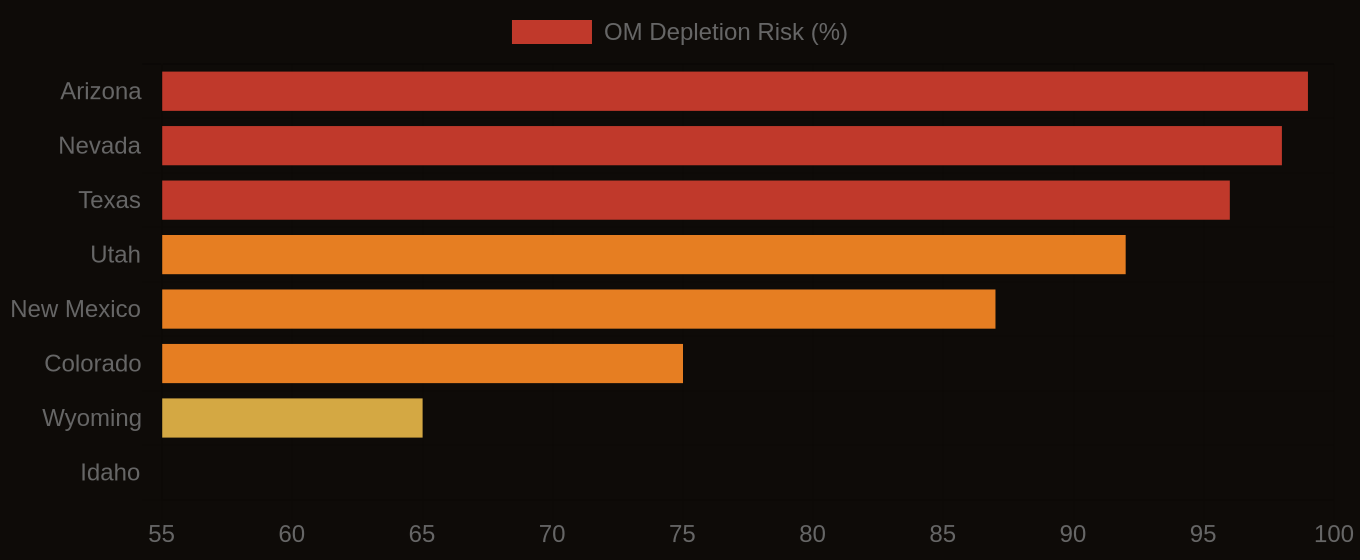
Organic Matter Depletion Risk by U.S. Region
| State / Region | Very High | High | Moderate | Low |
|---|---|---|---|---|
| Southwest | 72% | 20% | 6% | 2% |
| Great Plains | 48% | 32% | 14% | 6% |
| Southeast | 38% | 30% | 22% | 10% |
| Corn Belt | 22% | 28% | 32% | 18% |
| Mountain West | 61% | 22% | 12% | 5% |
| Pacific NW | 18% | 24% | 36% | 22% |
| Northeast | 12% | 20% | 40% | 28% |
The Valuation Gap
Precision agriculture managers can use these detailed insights to optimize nitrogen application rates, reducing both input costs and environmental impact. For agricultural lenders and nitrogen credit markets, this data provides a fundamental layer for risk assessment and valuation. The pathway to more efficient nitrogen use and cleaner water begins with interpreting existing soil data, much of which is readily accessible yet often underutilized. Interactive map: Visualize nitrate leaching risk across agricultural lands at lab10yr.com/Regenerative-Agriculture-Risk-Map
Organic Matter Depletion Risk — State Overview