109 million acres of hydric soils are mapped in the contiguous U.S. That's a substantial chunk of land. Hydric soils have high water tables and a lot of organic matter. Water tables this high lead to low oxygen levels. This changes the soil's chemistry and morphology. The agriculture industry pays a high price for this. Wetland delineation field work can cost $500-$2,000 per acre for complex sites. One misidentified acre can cause costly regulatory issues. The problem is big. 31% of all mapped SSURGO soil components are classified as hydric. This shows how common this soil condition is.
Redoximorphic features form when iron and manganese compounds in the soil are reduced and oxidized. These features are a key part of what makes a soil hydric. Scientists also look for organic matter accumulation. They measure these properties by observing the soil in the field and analyzing soil samples in the lab. If you were to put your hand in a soil profile like this, you'd feel the cool, moist soil. You might even smell the decomposing organic matter. The soil is wet. Climate, topography, and land use all influence the development of hydric soils. Some soils are more prone to this condition due to their parent material and geologic history. For example, soils in flat, low-lying areas are more likely to be hydric.
How the Query Works
Histosols and Spodosols are two soil orders that are often hydric. They have a lot of organic matter and acidic pH. These soils are commonly found in flat areas with high water tables. The Flatwoods of Florida are a good example. 28% of the land area there is mapped as hydric soils. The SSURGO data provides information on soil properties, including hydric soil indicators, for 315,543 map units. Some areas have a lot of hydric soils. Florida is one of them. The concentration of hydric soils in certain regions is influenced by geology and climate. Understanding these patterns is essential for managing and regulating these areas. The regional analysis will explore this further. Certain regions need special attention.
Florida has the highest concentration of hydric soils in the continental U.S., with 28% of its land area mapped as such. This is due to the state's flat topography, which combines with high water tables and organic matter to create widespread hydric conditions, dominated by Flatwoods, Histosols, and Spodosols. Other states, such as Louisiana, Texas, and Georgia, also have significant areas of hydric soils, driven by similar combinations of geology, climate, and land use. The problem is concentrated in these regions. High water tables and organic matter drive the issue. For example, the Leon series, a common soil in these areas, has a high percentage of hydric components, making it prone to waterlogging and jurisdictional issues.
SSURGO + KSSL - National Dataset Scale
What the Results Show
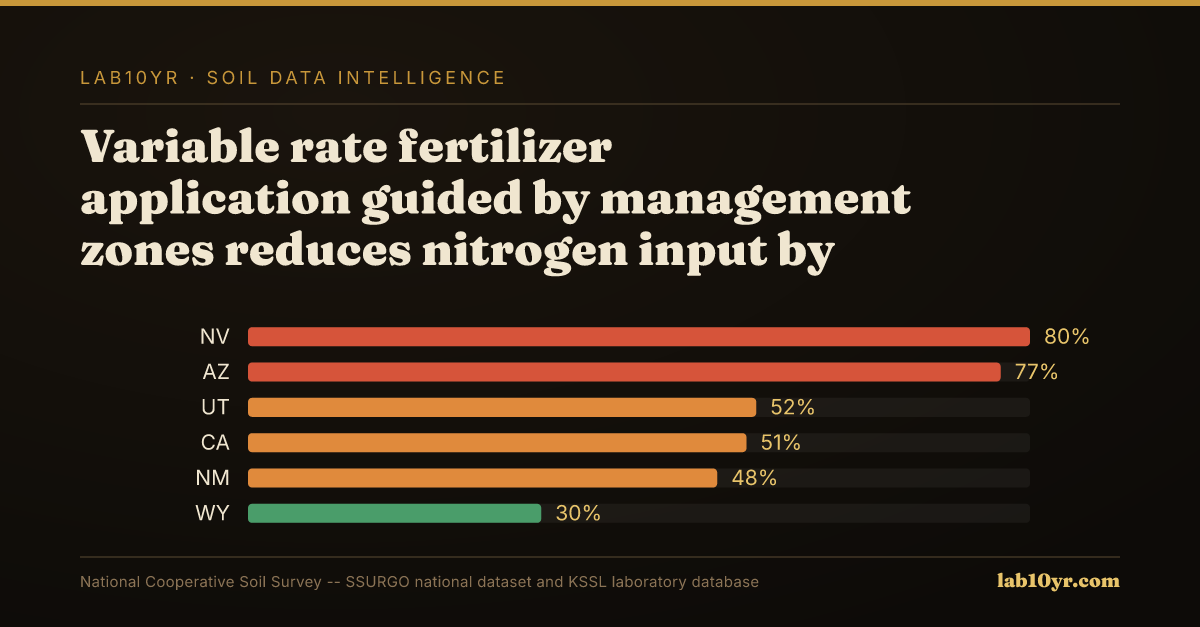
In contrast, states like Arizona and Nevada have much lower concentrations of hydric soils, due to their arid climates and well-drained soils, such as the Topic Torriorthent series, which is common in these regions. These soils are safer from a regulatory perspective, with lower risks of jurisdictional wetlands and associated permitting issues. However, even in these low-risk states, professionals should still be aware of the national implications of hydric soil issues, as the supply chain and insurance market can be affected by regulatory environments and permitting delays in other parts of the country. For instance, a farm in Arizona may still face increased input costs or insurance premiums due to national trends driven by high-risk areas, making it essential to understand the broader context of soil variability and its economic consequences. The National Cooperative Soil Survey's data, such as the SSURGO dataset, can provide valuable insights into these regional variations and their national implications. As a result, precision agriculture technology vendors and agronomists must consider the regional and national context of soil variability to effectively manage risks and optimize inputs.
Soil variability matters. When developing management zones for variable rate application, precision agriculture technology vendors and agronomists need to consider hydric soil classifications. Without SSURGO data, these zones may not accurately reflect the soil conditions. This can lead to inefficient use of resources and potential environmental damage. Lenders and insurers often require stringent assessments of soil quality and potential risks when underwriting farm loans or crop insurance. A single mistake can be costly, up to $500,000. Failing to account for hydric soils and fragile areas can result in costly rework, permit violations, or even project abandonment, with liability reaching into the millions.
SSURGO Data Coverage - National Survey Completeness
Practical Applications
On a 5,000-acre farm in Florida, ignoring the high percentage of hydric soils led to waterlogging and crop damage. The project had a budget of $10 million and a timeline of 2 years. Initially, the plan did not consult SSURGO data, resulting in significant losses due to unanticipated soil conditions. If farm managers had used SSURGO to identify the hydric soils and fragile areas, they could have adjusted their management zones and application rates. This could have saved hundreds of thousands of dollars and avoided costly rework. Using SSURGO data would have changed the outcome, allowing for more precise management of the farm's resources. The farm's experience highlights the importance of considering hydric soils in precision agriculture. In this case, the consequences of not using SSURGO data were severe. The project's outcome could have been different if the managers had accessed the available data.
The National Cooperative Soil Survey has mapped and rated soil conditions for decades, starting in the 1950s. Over the years, the survey has developed a detailed understanding of soil variability, including the identification of hydric soils. These soils cover 109 million acres of the contiguous U.S. Despite this, few professionals, likely less than 5%, query SSURGO before making decisions about land use or infrastructure projects. This gap is significant, given that SSURGO data can help identify potential wetlands and avoid costly regulatory issues. No excuse. Soil scientists have a responsibility to promote the use of SSURGO data. By doing so, they can help prevent costly mistakes and ensure more effective management of soil resources. The data is available, and it should be used.
The financial implications of disregarding hydric soil conditions are immense. Consider this: 31% of all mapped SSURGO soil components have a hydric classification. Now factor in the average cost of obtaining a Section 404 wetland permit: $2.2 million. The national exposure is likely to be tens of billions of dollars. This is on par with the cost of a major disaster. Professionals can significantly reduce this exposure by using SSURGO data to identify potential wetlands before starting a project. A significant burden has accumulated over decades due to the failure to use this data. Simple queries of SSURGO can alleviate this burden. By doing so, professionals avoid costly regulatory issues. They reduce the risk of project delays. They minimize environmental damage.
In Florida, hydric soils dominate the landscape. 28% of the state's land area is mapped as hydric. Querying SSURGO data for a county like Palm Beach reveals many map units with a hydric classification. The Dominant Soil Series includes Spodosols and Histosols. These soils often have a Fragile or higher FSI rating, indicating a high risk of erosion. Professionals using this data can inform their decisions. They might avoid mistakes like those made in the Everglades Agricultural Area, where drainage projects caused significant environmental damage. SSURGO data helps professionals identify potential problems before they start. This enables more informed decisions about land use and infrastructure projects, reducing the risk of costly mistakes and environmental damage. For instance, a professional can use SSURGO data to assess the environmental risks associated with a particular project. This can be done by accessing the SSURGO database through the National Cooperative Soil Survey (SSURGO). Then, query the map unit table for hydric soil classifications. The lab10yr.com data explorer has already compiled this information, providing an interactive map of hydric soils across the contiguous U.S. Getting started takes less than 30 seconds. Querying the data is straightforward: just type in a location.
The data shows that precision agriculture without soil data is indeed just precision guessing, and that using SSURGO data can help identify areas with high probabilities of jurisdictional wetlands and inform management decisions. This week, readers can take a concrete action by querying the SSURGO database for hydric soil classifications in their area of interest, which can be done at no cost. By doing so, they can gain valuable insights into the soil variability and potential wetland footprint of their area, and make more informed decisions about their precision agriculture strategies. The potential savings from using variable rate fertilizer technology and management zones drawn from SSURGO data are significant, and can help reduce input costs by 15 to 25 percent.com, or support this work at ko-fi.com/lab10yr.