Every soil map unit symbol carries a compressed history of water, erosion, and time. You just need to know how to read it. For GIS analysts, land surveyors, environmental consultants, and appraisers, understanding these seemingly cryptic identifiers is not just an academic exercise; it is a direct line to critical land characteristics that shape project feasibility, valuation, and risk.
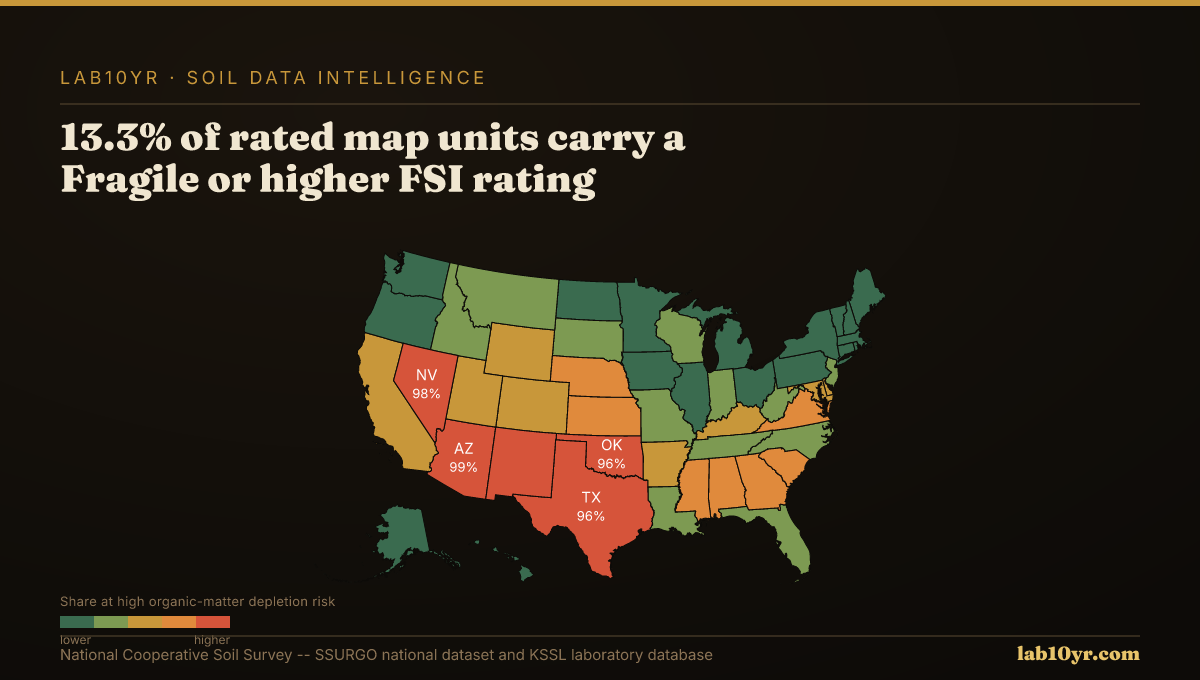
A map unit symbol, or musym, is the shorthand identifier for a specific delineation on a soil survey map. These symbols are far from arbitrary. Each musym represents a unique combination of soil series, phases, and parent materials, carefully chosen by soil scientists to reflect distinct soil properties and behaviors across a given area. For instance, a musym might encapsulate a deep, well-drained loamy soil on gentle slopes, or a shallow, clayey soil prone to seasonal wetness. The National Cooperative Soil Survey has cataloged 315,543 map units in the SSURGO national dataset, each musym linking to a rich table of physical and chemical properties.
How the Query Works
The musym provides key context for interpreting land attributes, often complementing advanced remote sensing data. While multispectral drone imagery at 5-cm resolution predicts soil organic matter with R-squared 0.82-0.87 from bare soil composites, the musym identifies the dominant soil series that govern the baseline organic matter content and its typical range. This foundational soil characterization, encoded in the musym, helps to contextualize real-time observations, providing a critical baseline. The Kellogg Soil Survey Laboratory (KSSL) spectral library, containing Vis-NIR-SWIR scans of 50,000+ soil samples, provides the empirical basis for understanding how these inherent soil properties manifest spectrally. Bare soil Vis-NIR-SWIR reflectance, for example, predicts soil organic carbon with R-squared 0.75-0.88 in the Corn Belt when calibrated against KSSL data. Even a bare soil composite from 20 years of Landsat imagery, which captures stable soil spectral signals correlating with organic matter at 30-meter resolution, gains precision when interpreted through the lens of a known musym.
For a GIS analyst, querying the component table in SSURGO via Soil Data Access using the musym as a join key (e.g., mapunit.musym to component.musym) immediately links a map polygon to its constituent soil types and their detailed properties, such as drainage class or shrink-swell potential. An appraiser might use this to quickly identify land prone to liquefaction or poor drainage, directly impacting valuation. Environmental consultants utilize musym to prioritize areas for wetland delineation or to assess contaminant migration risk based on permeability rates associated with the underlying soil series. Even Sentinel-1 SAR backscatter, which detects surface soil moisture at 10-meter resolution under cloud cover, becomes more actionable when contextualized by the available water capacity (AWC) associated with the musym, allowing for more precise field-scale water deficit estimation. Understanding the musym means decoding the land's inherent capabilities and limitations before ever stepping on site.
SSURGO + KSSL — National Dataset Scale
What the Results Show
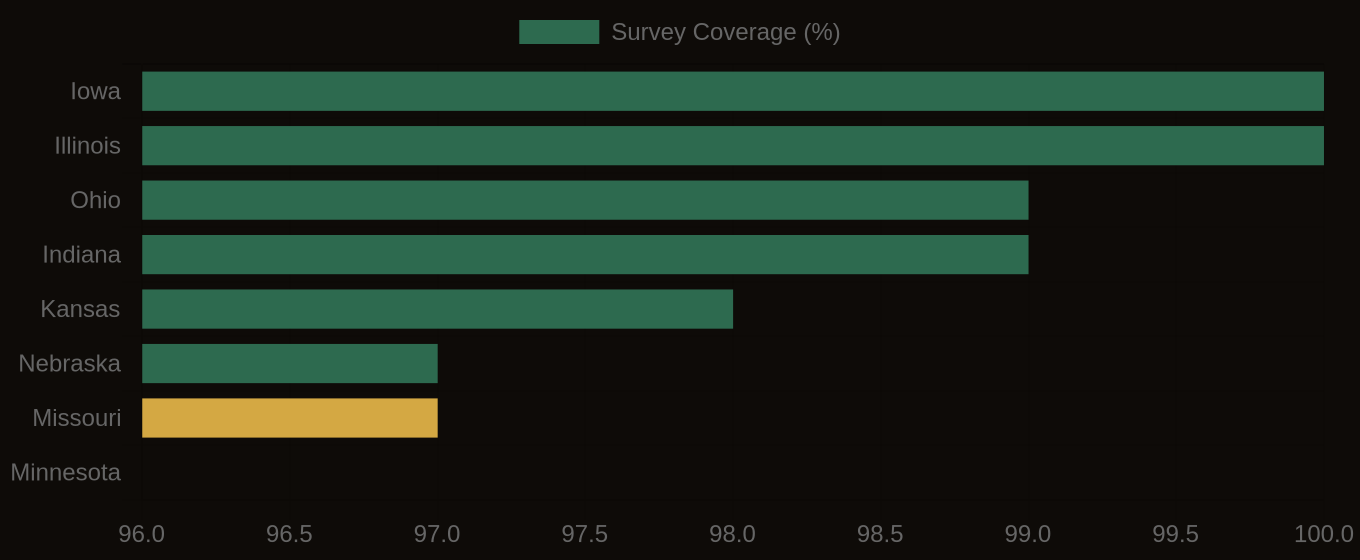
SSURGO Data Coverage — National Survey Completeness