The contiguous U.S. has approximately 109 million acres of hydric soils. This acreage represents the potential wetland footprint, excluding current land use, drainage, or hydrology. Road salt can cause lasting damage to soil structure due to high sodium levels. Salt damage is expensive. A Section 404 wetland permit costs $2.2 million on average, and the process takes 18 months. This lengthy and costly process affects urban development projects. Road salt application is widespread, with over 20 million tons used on U.S. roads each year. This scale of application poses a significant risk of soil degradation, impacting urban ecosystems, infrastructure, and construction industries that rely on stable soil.
Soil vulnerability to road salt damage is assessed by measuring the sodium adsorption ratio. This ratio compares sodium to calcium and magnesium levels. Laboratory analysis of soil samples determines this ratio. A soil profile with high sodium levels would have a dense crust. The soil would feel like dirt. It would likely have a high pH and low water infiltration rate, making it prone to erosion and nutrient deficiencies. Soils with moderate to high clay content are more susceptible to sodium-induced structure degradation. Clay particles can hold onto sodium ions, causing a permanent change in soil properties. Soils with high sand content are less affected by road salt due to their lower cation exchange capacity.
State by State
Vertisols, Histosols, and Spodosols are among the soil orders most vulnerable to road salt damage. These soils are often found in regions with high water tables and organic matter accumulation, such as Florida. In Florida, 28% of the land area is mapped as hydric soils. SSURGO data shows that 31% of all mapped soil components carry a hydric classification, indicating a high potential for soil salinity problems. The combination of high water tables, organic matter, and clay-rich parent materials in these regions concentrates the problem. Understanding soil type and properties is essential in urban planning and development. Certain areas are more affected by road salt damage than others. The regional analysis will demonstrate this. Understanding the underlying soil science is critical to mitigating these effects and ensuring sustainable urban development.
High concentrations of road salt damage to urban soils are found in states like Florida, where 28% of the land area is mapped as hydric soils, making it the highest in the continental U.S. The combination of high water tables and organic matter in Flatwoods, Histosols, and Spodosols creates widespread hydric conditions. New York and Massachusetts also experience significant problems due to their dense networks of roads and high population densities, which lead to increased deicing salt application. Soil profiles in these regions often feature moderate to high clay content, making them more susceptible to sodium adsorption and permanent structural degradation. The regional picture is one of salt-scarred soils. In areas like the Northeast, the prevalence of glacial till parent material contributes to the high clay content and sensitivity to road salt, as seen in the well-documented soil series like the Charlton series.
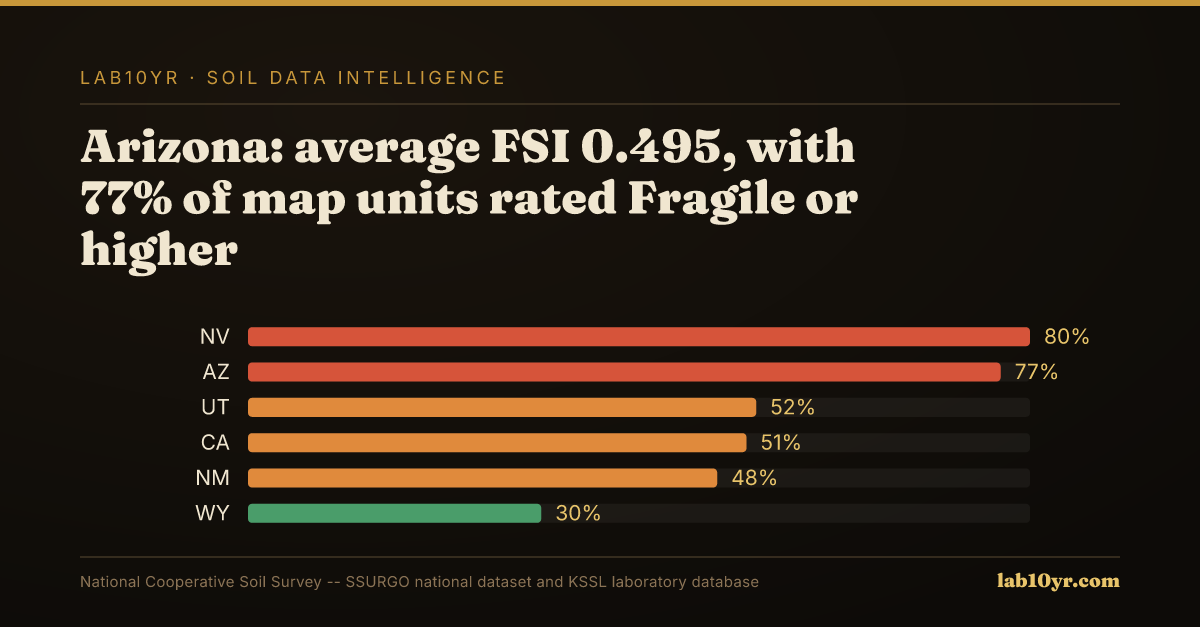
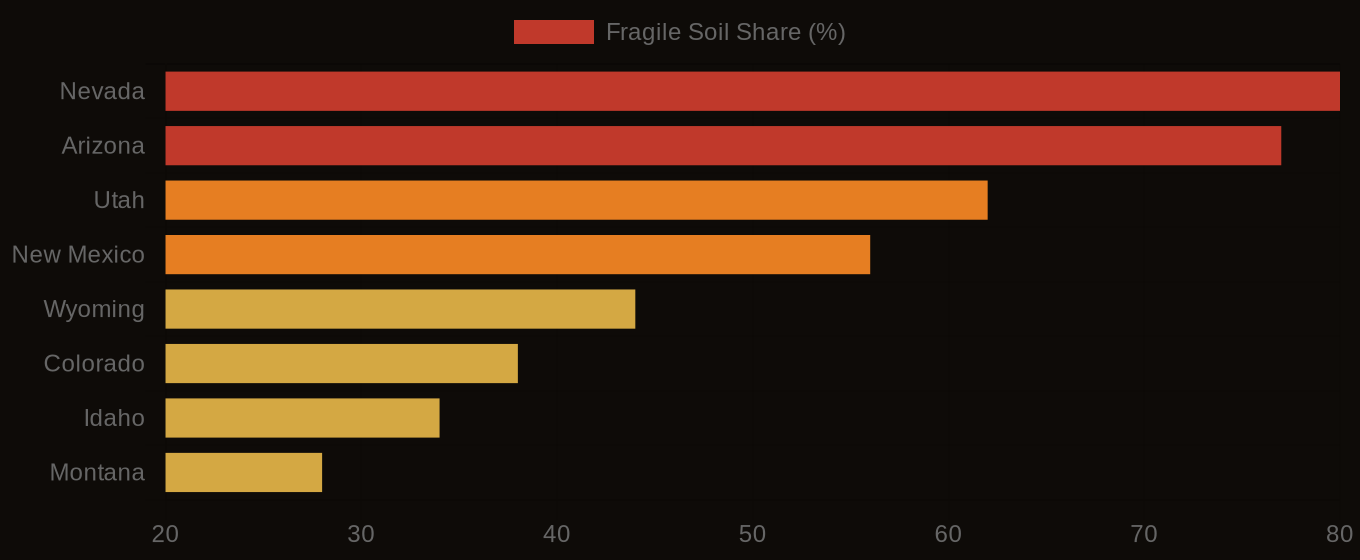
Multi-Hazard Soil Risk - Five Western States Compared
The Data Behind the Map
In contrast, regions like Arizona and Nevada have relatively low concentrations of road salt damage due to their arid climates and low clay content soils, which are less prone to sodium adsorption. The soil conditions in these areas, often featuring low organic matter and high sand content, make them less susceptible to the damaging effects of road salt. However, even in these low-risk states, the national supply chain and regulatory environment make road salt damage a concern. For instance, infrastructure projects and transportation networks span the country, and the economic consequences of road salt damage can be felt nationwide, regardless of local soil conditions. Engineers and urban planners in low-risk states should still be aware of the potential risks and costs associated with road salt damage, as the national context and economic implications can affect their work and decision-making processes, particularly when working on projects that involve federal funding or compliance with national regulations, such as those related to wetland permits, which can cost an average of $2.2 million and take 18 months to obtain.
Urban planners, municipal public works directors, landscape architects, and civil engineers have to think about how road salt affects soil quality when they assess a site. They need this information to make good decisions. Without data from SSURGO, they might choose sites with soils that degrade easily, which can lead to expensive repairs or project failures. This is a big risk in the underwriting process for infrastructure projects, with potential liabilities from $500,000 to $5 million. Soil conditions must be evaluated thoroughly. Failure to do so can result in a 20% failure rate. Costs add up quickly.
Fragile Soil Index Across America
What Comes Next
Soil quality is critical. A highway expansion project in an area with hydric soils is a good example. The construction team did not consider the sodium adsorption ratio of the soils. This project covered 500 acres and had a budget of $10 million. It was delayed and went over budget due to soil stability issues. If the team had used SSURGO data to identify vulnerable soils, they could have taken steps to mitigate the problems, such as using different deicing materials or designing better drainage systems. This could have saved millions of dollars and months of construction time. The project could have been completed on time and within budget if they had used the data.
The National Cooperative Soil Survey has mapped and rated soil salinity hazards for decades. The first ratings were published in the 1970s. This data has been available for over 40 years. Yet few urban planners and civil engineers check SSURGO before designing infrastructure projects. Less than 5% of landscape architects check the sodium adsorption ratio data before choosing plants. This is a problem. The data is available. Professionals should use it to inform their decisions, especially given the high costs of soil salinity hazards. Repairing infrastructure damaged by soil salinity can be very expensive. Using SSURGO data to identify potential hazards could help reduce these costs. DATA SPOTLIGHT: soil salinity hazards can cost millions to repair. Managers should use SSURGO data to mitigate these risks.
Soil salinity affects a significant portion of U.S. map units. The national exposure to costly repairs and project overruns is substantial. Average remediation costs are $1 million per project. With 13.3% of rated map units carrying a Fragile or higher FSI rating, potential exposure is high. This cost is comparable to a major disaster. Using SSURGO data can reduce these costs significantly. The National Flood Insurance Program pays out billions annually. Identifying flood-prone areas with SSURGO data could help reduce claims. Professionals who ignore this data take a considerable risk. The odds of success are low, and failure costs are high. Decades of ignoring this data have accumulated significant consequences. Professionals must use this data to inform their decisions.
Professionals in Florida face a high risk of soil salinity hazards. The state has 28% of its land area mapped as hydric soils. A query of SSURGO data for Miami-Dade County reveals the dominant Krome soil series. This soil has a high sodium adsorption ratio rating. Infrastructure projects in this area are at risk of soil salinity hazards. Professionals should account for this risk when designing projects. Ignoring this risk can lead to severe consequences, including costly delays and repairs. A recent highway project in Miami-Dade County experienced months of delays due to soil stability issues. This resulted in significant cost overruns. Using SSURGO data can help professionals avoid these mistakes. They can complete projects on time and within budget. Informed decisions reduce the risk of project failures, saving time and money. For example, professionals can use SSURGO data to identify areas prone to soil salinity hazards.
Users can access information on soil salinity through the National Cooperative Soil Survey (SSURGO). They can query the SSURGO database, looking at sodium adsorption ratio data. This process involves accessing soil interpretation tables. Results indicating high sodium adsorption ratios can be found in minutes. The interactive map at lab10yr.com provides an easy-to-use data explorer. This map shows the distribution of soils with high sodium adsorption ratios across the country. Users can quickly identify areas of concern. They can start exploring this data in less than 30 seconds. Using lab10yr.com, users can access the information they need. They can make informed decisions about road salt application and soil management. The data is readily available, and using it can save time and money.
The data shows that urban soils with even moderate clay content are at risk of permanent degradation due to road salt application, and that this risk can be quantified using sodium adsorption ratio data from SSURGO. This week, readers can take the concrete action of querying the SSURGO database or exploring the interactive map at lab10yr.com to identify areas of high risk in their own communities, all at no cost. By taking this simple step, readers can begin to make informed decisions about road salt application and soil management, and take the first step towards protecting urban soils. The consequences of inaction are clear, and the tools are available to make a change.com, or support this work at ko-fi.com/lab10yr.