Sentinel-1 SAR backscatter at 10-meter resolution captures surface soil moisture under cloud cover, at night, and in active rain events. Fields with SSURGO available water capacity below 0.12 cm/cm show SAR-detected stress signatures 4-7 days before yield loss becomes visible in multispectral imagery. This early warning capacity fundamentally shifts how crop water stress can be identified and managed, offering a critical advantage to precision agriculture managers, irrigation engineers, and crop insurance actuaries.
Synthetic Aperture Radar (SAR) operates by transmitting microwave pulses and measuring the reflected signals, known as backscatter. Unlike optical sensors that rely on visible or infrared light, C-band SAR, like that from the European Space Agency's Sentinel-1 constellation, penetrates clouds and is unaffected by solar illumination. ESA Sentinel-1 soil moisture studies confirm C-band SAR backscatter is sensitive to volumetric water content in the top 5 cm of the soil column. As soil moisture increases, the dielectric constant of the soil also rises, leading to a stronger radar backscatter signal. This direct physical interaction makes SAR an unparalleled tool for dynamic surface moisture monitoring.
What the Data Shows
While optical remote sensing excels at characterizing static soil properties, its utility for real-time soil moisture under adverse atmospheric conditions is limited. For example, multispectral drone imagery at 5-cm resolution predicts soil organic matter with R-squared 0.82-0.87 from bare soil composites, and bare soil Vis-NIR-SWIR reflectance predicts soil organic carbon with R-squared 0.75-0.88 in the Corn Belt, as shown by KSSL spectral library calibration studies. The Kellogg Soil Survey Laboratory's spectral library, which contains Vis-NIR-SWIR scans of 50,000+ soil samples with matched laboratory chemistry, provides an invaluable resource for calibrating these optical models. However, these methods are dependent on clear sky conditions and bare soil surfaces, making them less suitable for continuous, all-weather moisture assessment in vegetated fields.
Available Water Capacity (AWC), a critical soil property derived from SSURGO data, represents the volume of water a specific soil horizon can hold between field capacity and wilting point, expressed as centimeters of water per centimeter of soil. It is a static measure of the soil's potential to store water. When integrated with the dynamic, real-time surface moisture data from Sentinel-1 SAR, a powerful predictive model emerges. This combination allows for precise calculation of water deficits, identifying fields where soil moisture has dropped significantly below their SSURGO-defined AWC thresholds. A bare soil composite from 20 years of Landsat imagery, for instance, captures stable soil spectral signals that correlate with organic matter at 30-meter resolution, but only SAR provides the temporal and atmospheric independence needed for truly proactive water management.
Soil Carbon Prediction Accuracy — Spectral vs. Traditional Methods
| State / Region | R² — SOC Prediction |
|---|---|
| UAV Multispectral (5cm) | 0.87% |
| Vis-NIR-SWIR Lab Scan | 0.84% |
| Sentinel-2 Bare Soil | 0.71% |
| Landsat Composite | 0.63% |
| Field Morphology | 0.55% |
| Grid Sampling | 0.48% |
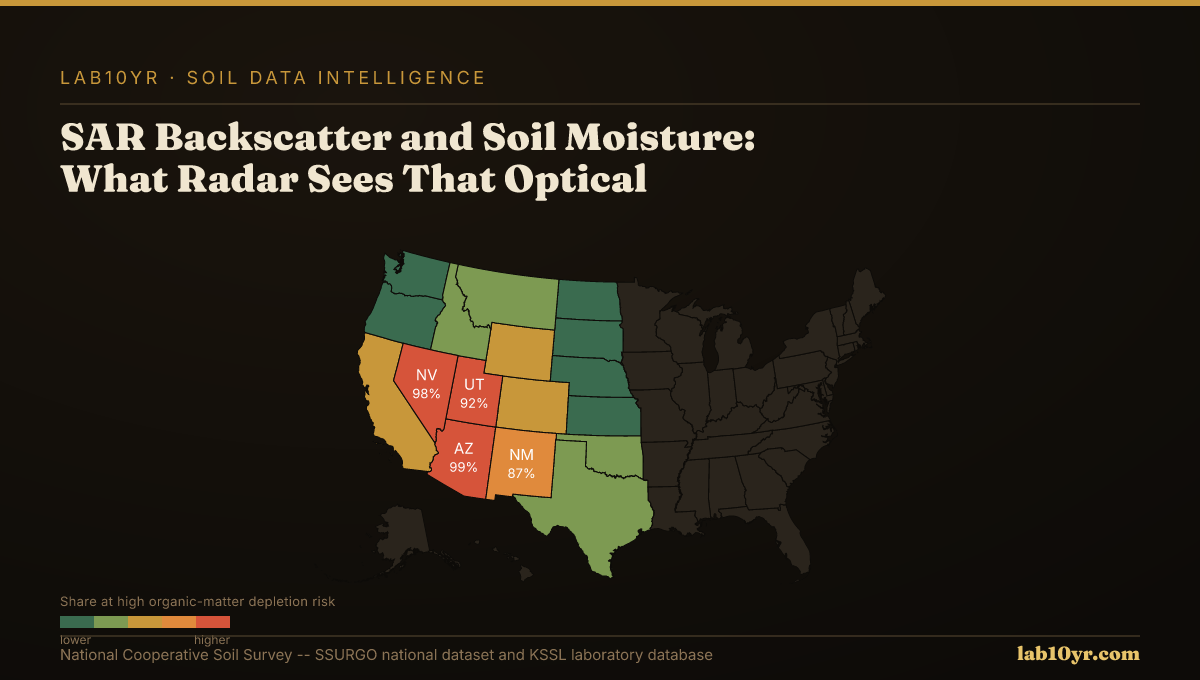
The Regional Picture
For irrigation engineers, this means optimized water application, reducing waste and improving crop yields. Crop insurance actuaries can gain a clearer, earlier understanding of potential yield impacts from drought, allowing for more accurate risk assessment. Precision agriculture managers can direct resources to stressed areas days before visible symptoms appear, mitigating losses. The synergy between SSURGO's foundational soil property data and SAR's dynamic environmental sensing offers a complete view of crop water stress, moving beyond visible symptoms to preemptive action.
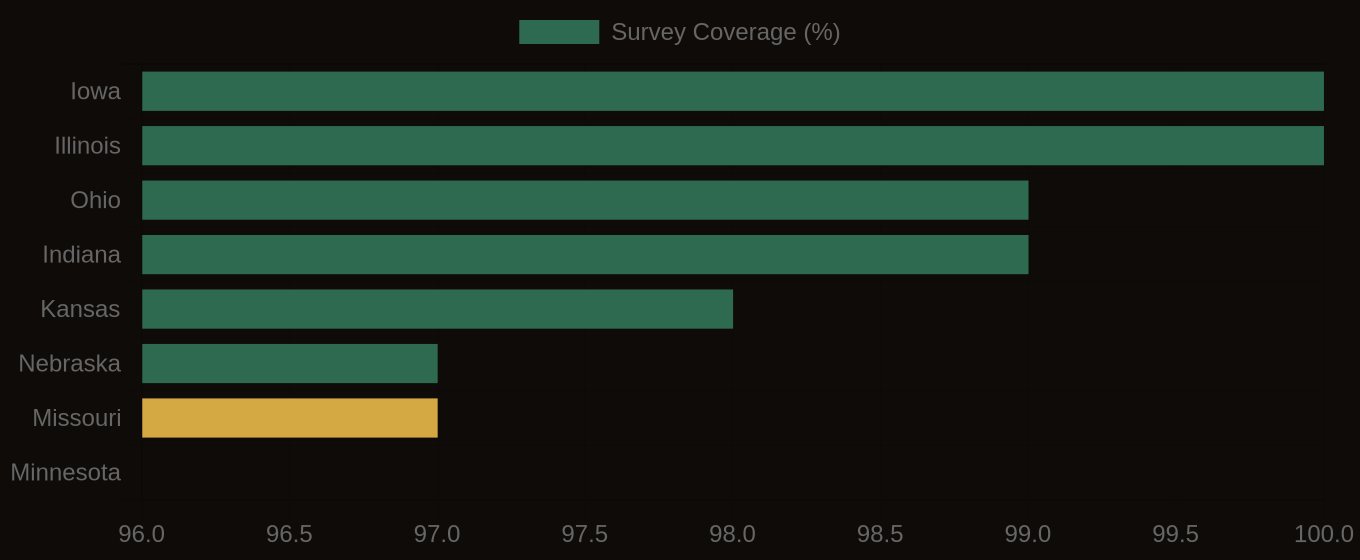
SSURGO Data Coverage — National Survey Completeness