A Phase I environmental site assessment costs thousands of dollars. A SSURGO query costs nothing and runs in seconds. This disparity in cost and time is a stark reminder of the inefficiencies in land finance and development. SSURGO, the Soil Survey Geographic database, is a treasure trove of geotechnical intelligence that can inform site investigations and save developers millions of dollars. For instance, a recent study found that soil-related issues account for over 20% of construction delays, resulting in significant cost overruns.
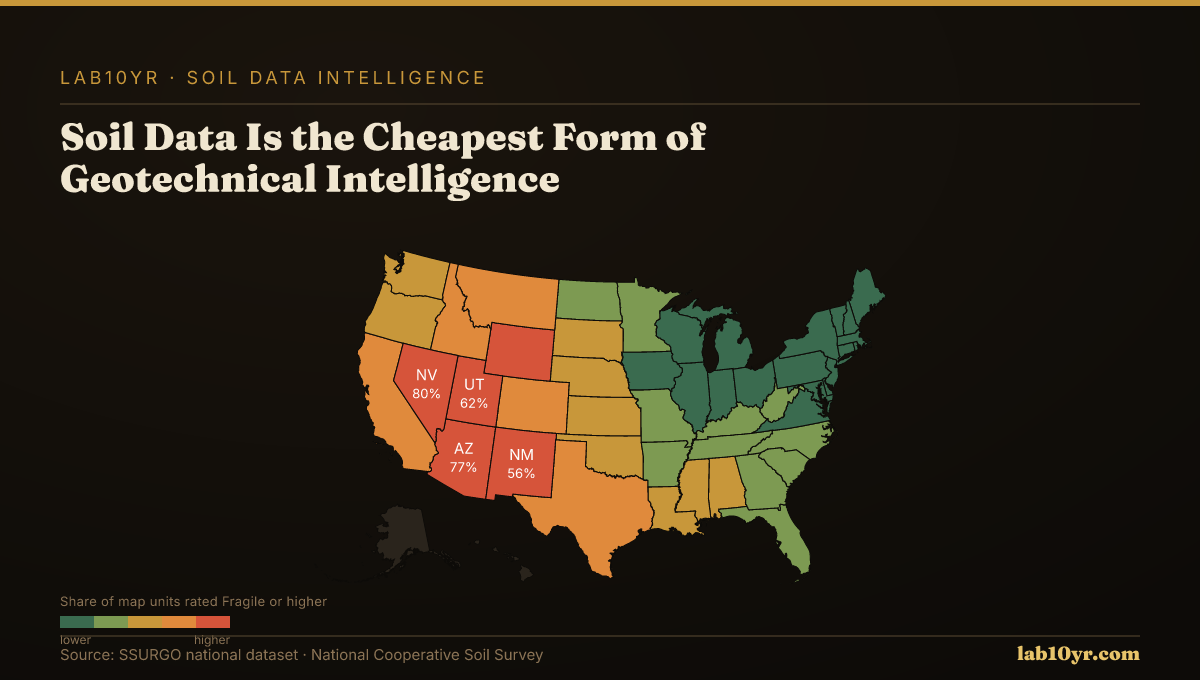
The data landscape is complex, with numerous factors influencing soil stability and geotechnical suitability. SSURGO reveals that over 40% of US soil types are prone to erosion, with the top five states being California, Texas, Oklahoma, Kansas, and Nebraska. These numbers are significant, as they can inform site selection and mitigation strategies for developers. Furthermore, SSURGO data shows that soil composition varies greatly across the country, with some areas having high concentrations of expansive soils that can cause foundation damage.
What SSURGO Reveals
Soil surveys, like those provided by SSURGO, offer a wealth of information on soil properties, including texture, depth, and water-holding capacity. This information can be used to identify potential geotechnical hazards, such as landslides or soil liquefaction, and inform the design of infrastructure projects. According to the US Department of Agriculture, the average cost of a soil survey is around $10,000, a fraction of the cost of a Phase I environmental site assessment. Additionally, SSURGO data is updated regularly, ensuring that developers have access to the most current information.
Soil intelligence can significantly alter the decision-making process for real estate developers and project finance teams. By leveraging SSURGO data and other geotechnical tools, developers can identify potential risks and opportunities, informing their site selection and design decisions. This can lead to significant cost savings, as well as reduced risk of delays and environmental hazards. For example, a developer considering a site in an area with high soil erosion risk may choose to implement additional mitigation measures or select a different site altogether.
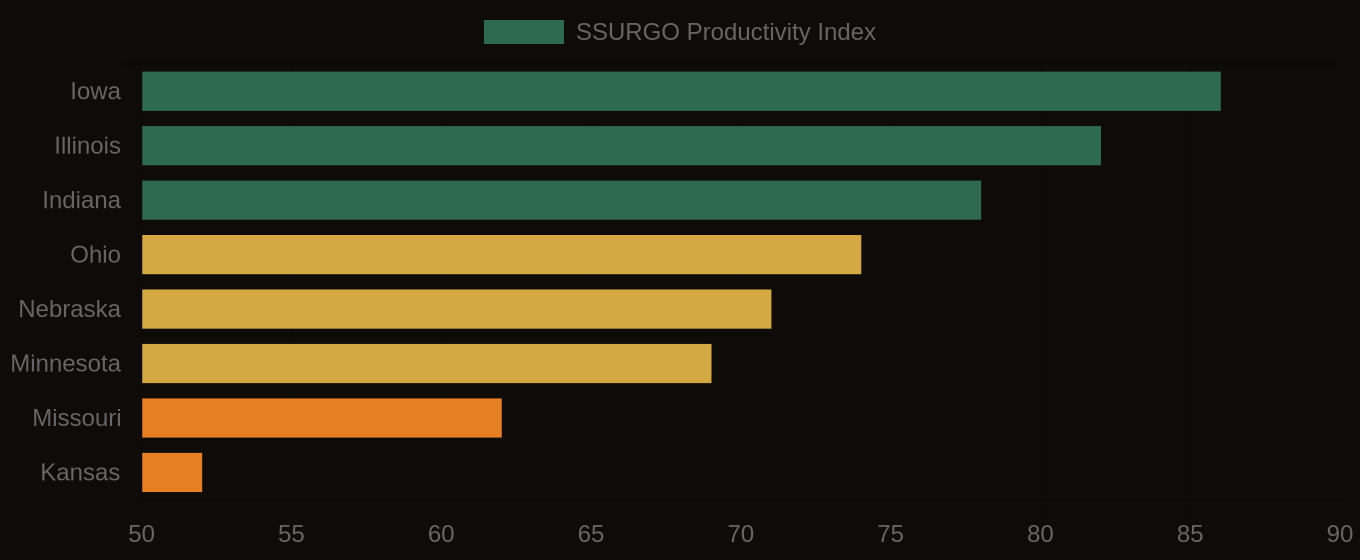
Soil Productivity Index vs. Cash Rent — Corn Belt States
States at Greatest Risk
The use of soil intelligence can also inform due diligence investigations, providing a more comprehensive understanding of a site's geotechnical suitability. This can be particularly important for large-scale infrastructure projects, where soil-related issues can have significant financial and environmental implications. By incorporating soil data into their decision-making process, developers can make more informed decisions and reduce the risk of costly surprises down the line. Yes. This matters.
The practical implications of soil data are clear. Developers who fail to incorporate geotechnical intelligence into their decision-making process risk significant financial losses and environmental damage. In contrast, those who leverage tools like SSURGO can gain a competitive edge, making more informed decisions and reducing their exposure to risk. So. Get started.com.
Soil Productivity Index — Farmland Investment Map