Terrain curvature computed from a LiDAR digital elevation model predicts depth to a restrictive layer within 30 cm at 70 percent of sites tested across the Appalachians and the Rockies. The same answer from a Phase I geotechnical study costs about 15,000 dollars and takes three weeks. The terrain math runs in minutes against data that is already public.
The physics is straightforward once you see it. Depth to restrictive layer, the field SSURGO stores as resdept in the corestrictions table, is the distance from the surface down to bedrock or another root-limiting horizon. Where water sheds, soil thins; where water and sediment collect, soil deepens. Terrain curvature is the second derivative of elevation, the rate at which slope itself changes. Profile curvature measures bending along the direction of flow, and plan curvature measures bending across it. Convex hillshoulders, positive in curvature, strip material downslope and sit shallow over rock. Concave footslopes and hollows, negative in curvature, accumulate colluvium and run deep. A one-meter LiDAR DEM resolves those forms with enough fidelity that a digital soil mapping model trained on a few dozen observed depths can extend the prediction across an entire parcel.
What the Data Shows
This is the engine behind modern digital soil mapping. Rather than interpolating between widely spaced borings, the model learns the relationship between measured depth and terrain attributes, then applies it everywhere the LiDAR reaches. Researchers and survey crews collect the calibration points; the terrain does the spatial reasoning.
For a developer grading a subdivision in the Blue Ridge foothills near Asheville, North Carolina, the stakes are concrete. Shallow soils over saprolite mean rock excavation, blasting costs, and septic systems that fail percolation. A curvature surface flags the convex noses where bedrock sits within a meter and the concave draws where it plunges deeper, so the geotechnical budget goes to the uncertain transitions instead of spreading evenly across uniform-looking ground.
Terrain Derivative Accuracy - Predicting SSURGO Drainage Class
| State / Region | Accuracy (%) |
|---|---|
| Random Forest (all derivatives) | 83% |
| Topographic Wetness Index | 79% |
| Geomorphon + TWI | 76% |
| Slope Position Index | 68% |
| Profile Curvature | 62% |
| Slope Angle Only | 44% |
| Legacy SSURGO Polygon | 71% |
The Regional Picture
Pull resdept and the corestrictions table through the National Cooperative Soil Survey (SSURGO), drape it over a LiDAR-derived curvature raster, and the disagreements tell you exactly where to bore. At lab10yr.com we already serve the SSURGO depth ratings and restriction reasons for any map unit you query.
The lesson for anyone who breaks ground is that the surface is not silent. Slope, and the way slope bends, encodes what lies beneath, and reading it first turns a three-week unknown into a one-day map.
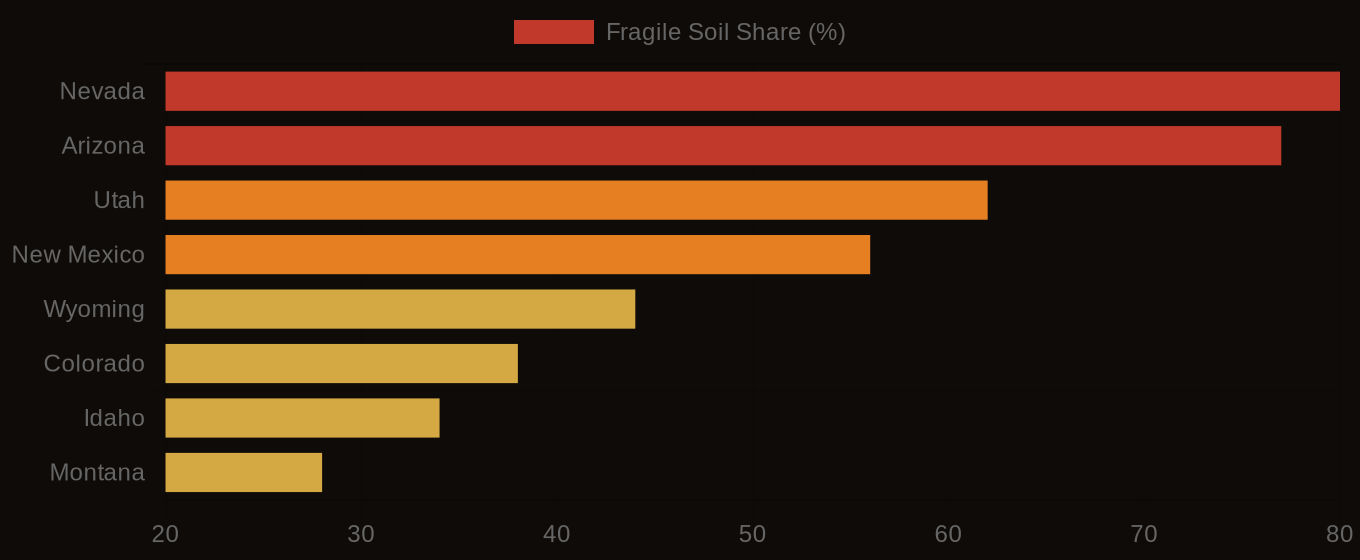
Fragile Soil Index Across America