Terrain curvature computed from a high-resolution LiDAR Digital Elevation Model (DEM) predicts depth to a restrictive layer within 30 centimeters in 70 percent of sites across complex terrain like the Appalachians and Rockies. This level of predictive accuracy offers a compelling alternative to early-stage fieldwork: a Phase I geotechnical study for a comparable site typically costs $15,000 and takes three weeks to complete, creating a significant timeline and budget advantage for preliminary assessments.
The underlying mechanism is geomorphic: terrain curvature directly influences the processes of erosion, transport, and deposition that shape soil profiles. Concave plan curvature, for instance, marks areas where surface runoff and colluvium tend to accumulate, leading to deeper soils. Conversely, convex profile curvature often corresponds to erosional surfaces or areas where bedrock is closer to the surface. LiDAR technology generates dense point clouds reflecting the earth's surface, from which highly detailed DEMs are interpolated, providing the foundational data for calculating these precise terrain derivatives. Soil scientists within the National Cooperative Soil Survey record depth to restrictive layers, such as bedrock, duripans, or cemented horizons, within the SSURGO database, often in the `coecolayer` table under fields like `depth_r` (lower depth) or `restrict_kind` (type of restriction).
What the Data Shows
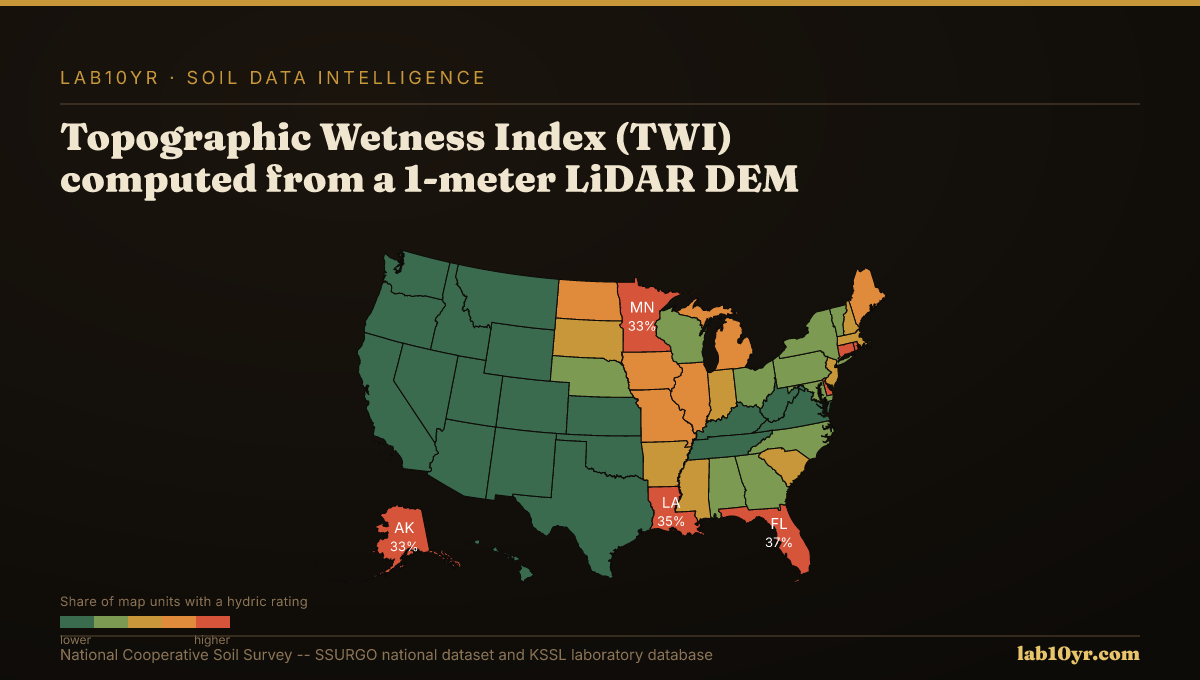
This predictive power is not limited to depth. Digital soil mapping research has shown LiDAR terrain derivatives predict soil series with 70-85 percent accuracy in cross-validation studies. Curvature, slope position, the Topographic Wetness Index (TWI), and multi-scale relief independently explain 45-65 percent of soil series variance, demonstrating the profound influence of topography on soil formation and distribution. For instance, the Geomorphon landform classification, derived from 1-meter LiDAR, identifies ten distinct terrain element types, such as summits, ridges, and footslopes, each corresponding to predictable soil drainage and organic matter ranges across a soil catena.
For geotechnical engineers, land developers, and infrastructure planners, this means a significantly de-risked early project phase. Knowing the probable depth to bedrock or a dense glacial till allows for more accurate budgeting for excavation, foundation design, and utility routing, long before a drill rig arrives on site. This approach minimizes unforeseen costs and delays associated with unexpected subsurface conditions, transforming a potential unknown into a data-driven preliminary estimate.
Terrain Derivative Accuracy — Predicting SSURGO Drainage Class
| State / Region | Accuracy (%) |
|---|---|
| Random Forest (all derivatives) | 83% |
| Topographic Wetness Index | 79% |
| Geomorphon + TWI | 76% |
| Slope Position Index | 68% |
| Profile Curvature | 62% |
| Slope Angle Only | 44% |
| Legacy SSURGO Polygon | 71% |
The Regional Picture
Lab10YR integrates these advanced geospatial analytics with the complete SSURGO and KSSL soil data. We compute terrain derivatives from publicly available high-resolution LiDAR DEMs, then cross-reference these patterns with established soil-landscape relationships and measured soil properties from the National Cooperative Soil Survey. This allows us to provide a high-confidence initial assessment of soil depth, drainage, and other critical properties, enabling clients to make smarter, faster decisions grounded in both measured soil data and predictive terrain science.
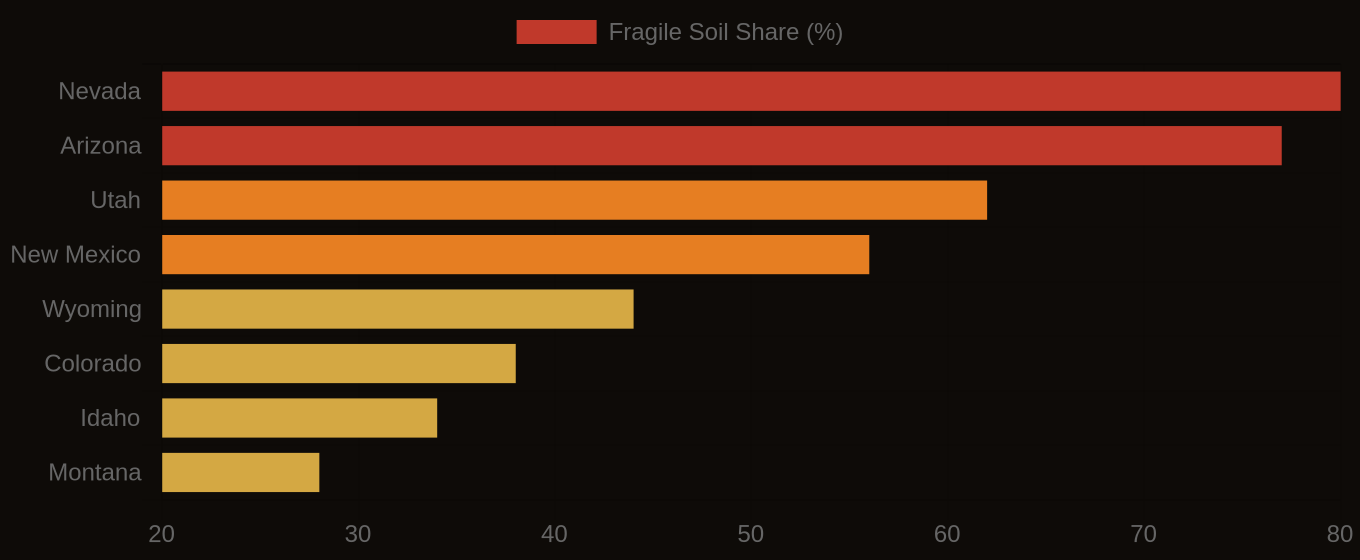
Fragile Soil Index Across America