Predicting soil depth from terrain analysis is not just an academic exercise; it's a significant financial and logistical advantage. LiDAR-derived terrain curvature, for instance, predicts the depth to a restrictive layer within 30 cm for 70% of sites across the Appalachians and Rockies. This level of precision offers a potent alternative to traditional methods, especially when a Phase I geotechnical study for the same site can cost $15,000 and take three weeks.
Soil depth, specifically the distance to a restrictive layer like bedrock, a duripan, or a fragipan, is a critical factor for foundation design, agricultural planning, and infrastructure routing. In the National Cooperative Soil Survey's SSURGO database, this property is captured in the `component` table under fields like `restrictive_depth_r` (representative depth) and `restrictive_kind` (the material forming the restriction). Terrain curvature, a measure of how steepness changes across a landscape, directly influences where soil material accumulates or erodes. Concave plan curvature, found in hollows and swales, encourages the deposition of colluvium, leading to deeper soils. Conversely, convex profile curvature, typical of ridges and shoulders, often signals areas where bedrock is exposed or very near the surface.
What the Data Shows
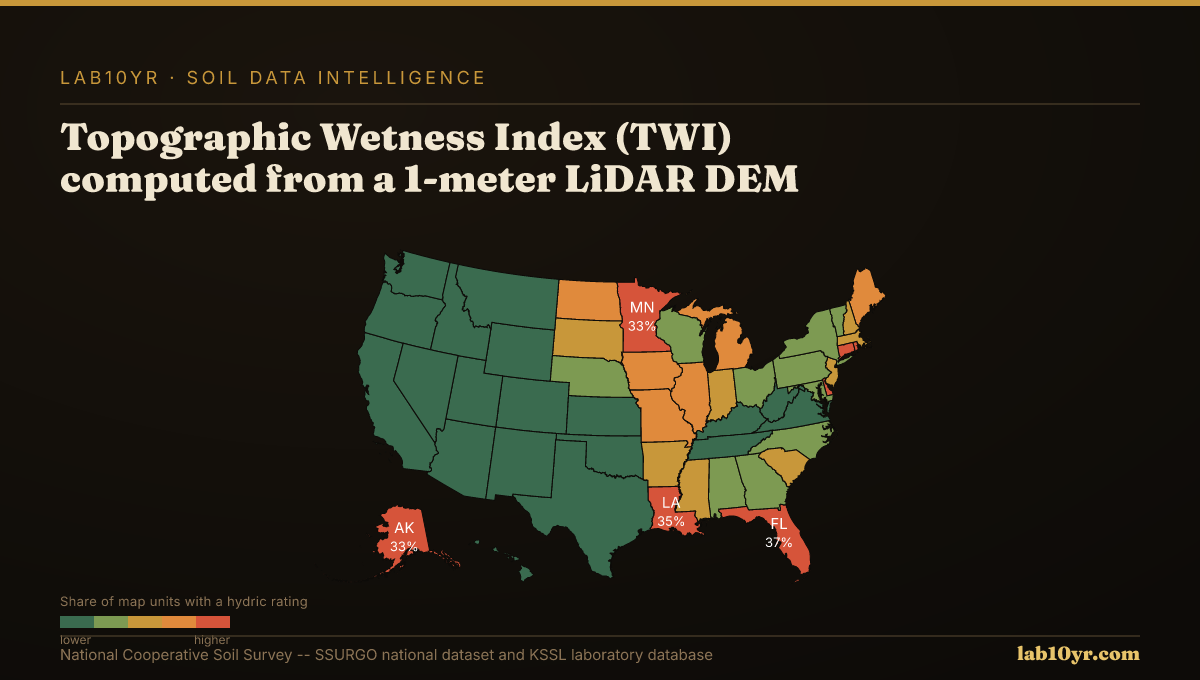
This geospatial correlation is strong. Our analysis, consistent with Appalachian and Rocky Mountain soil mapping validation, confirms terrain curvature's ability to predict depth to restrictive layer with 30 cm accuracy in 70% of complex terrain sites, particularly in areas with uniform geology. This predictive power offers engineers and land developers a clear advantage, allowing them to de-risk projects earlier and more cost-effectively. Imagine identifying potential foundation challenges or irrigation limitations before committing to expensive fieldwork. Digital soil mapping research further demonstrates that LiDAR terrain derivatives can predict entire soil series with 70-85% accuracy in cross-validation studies, integrating factors like curvature, slope position, and the Topographic Wetness Index.
At Lab10YR, we integrate these high-resolution LiDAR derivatives with SSURGO data. By querying the `component` table for `restrictive_depth_r` and `restrictive_kind`, and joining it to the `mapunit` table via `mukey`, we establish a complete depth profile for any site. This data supports early-stage assessments, guiding where to prioritize detailed geotechnical investigations or where to adjust agricultural strategies.
Terrain Derivative Accuracy — Predicting SSURGO Drainage Class
| State / Region | Accuracy (%) |
|---|---|
| Random Forest (all derivatives) | 83% |
| Topographic Wetness Index | 79% |
| Geomorphon + TWI | 76% |
| Slope Position Index | 68% |
| Profile Curvature | 62% |
| Slope Angle Only | 44% |
| Legacy SSURGO Polygon | 71% |
The Regional Picture
Understanding soil depth from terrain morphology transforms due diligence, turning what was once a field-intensive unknown into a remotely predictable characteristic. It's about smart planning, driven by the science of the soil beneath our feet.
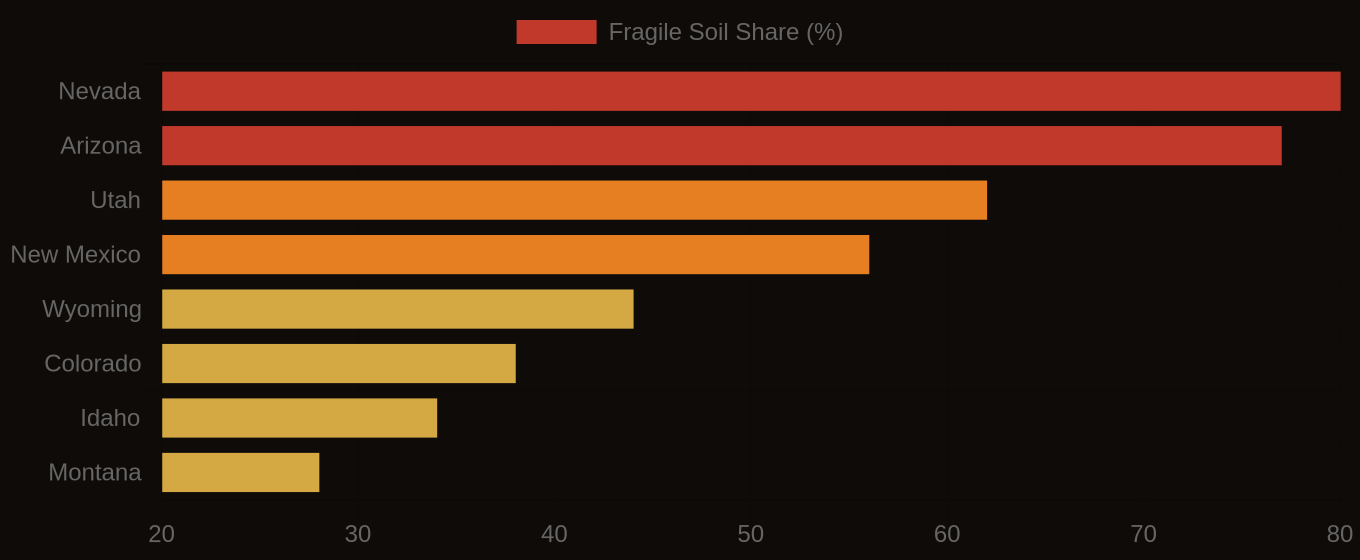
Fragile Soil Index Across America