LiDAR reveals microrelief features like gilgai, playa basins, and thermokarst at a 1-2 meter scale that 30-meter satellite imagery cannot resolve. This high-resolution terrain data is critical because each of these microtopographic expressions corresponds to distinct soil series with different drainage class, salinity, and shrink-swell behavior, properties directly influencing soil fragility. For instance, gilgai microrelief, common in Vertisols, indicates swell-shrink clays that contribute to higher Fragile Soil Index (FSI) ratings due to inherent instability.
The National Cooperative Soil Survey computes FSI from measured properties: organic matter, clay content, bulk density, and aggregate stability. This interpretation, in the `cofragidx` field of SSURGO's `cofrag` table, quantifies a soil's susceptibility to breakdown. Standard satellite elevation models smooth subtle variations. LiDAR, an active sensor, generates accurate digital elevation models that identify precise soil boundaries aligned with these microfeatures.
What the Data Shows
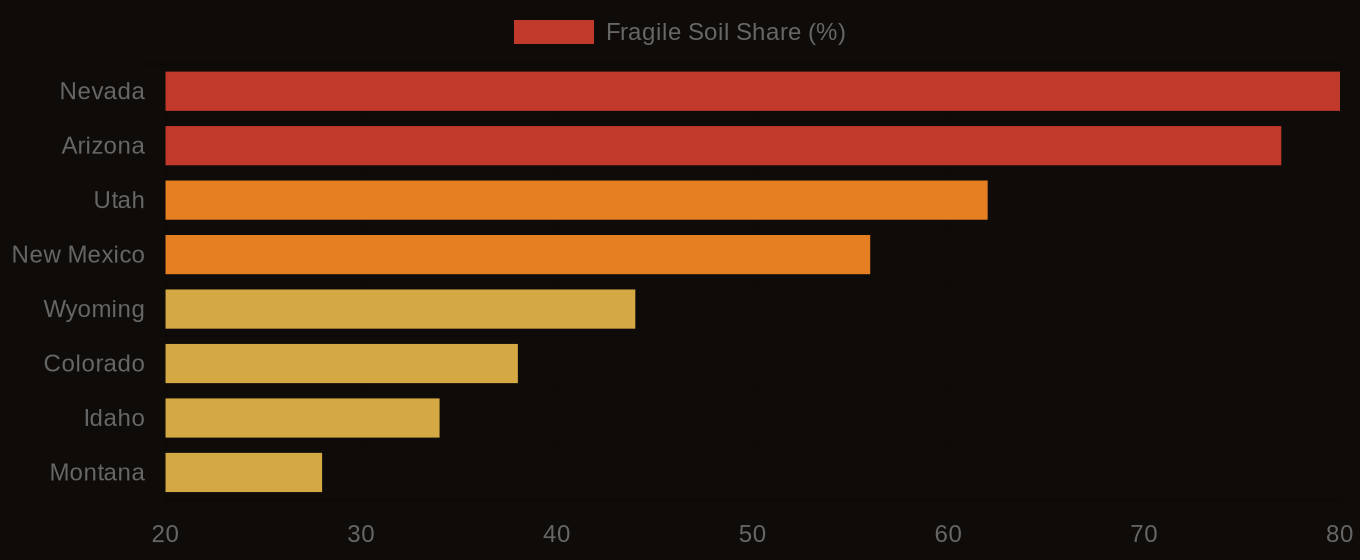
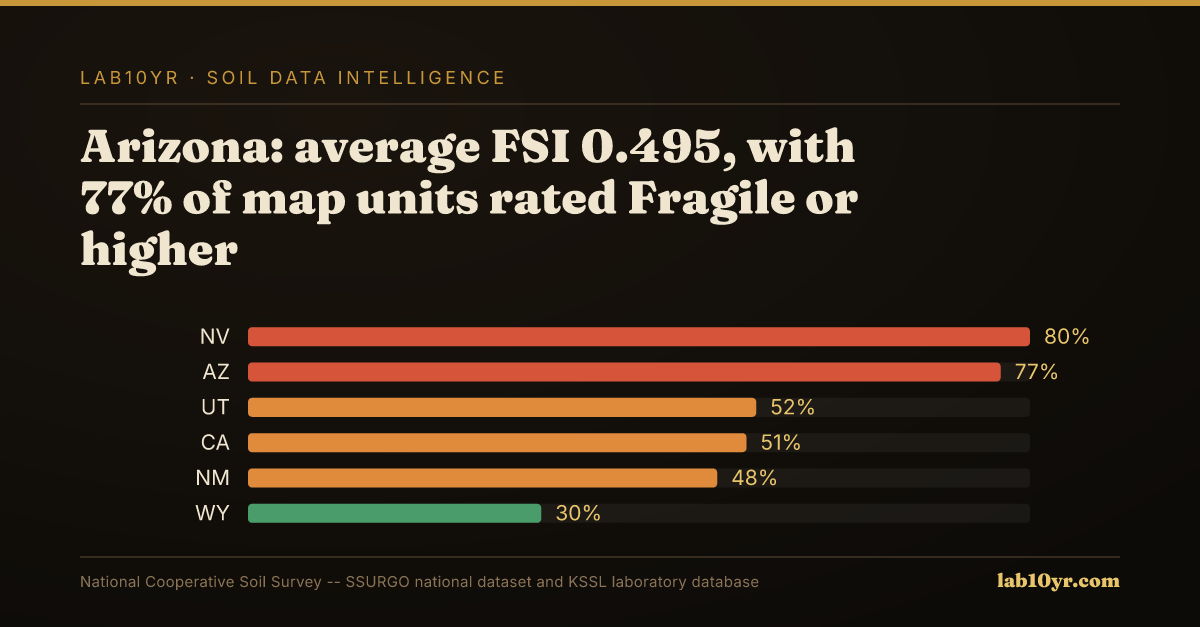
This distinction is particularly important across the arid Southwest, where fragile soils are widespread. Nevada holds the continental U.S.'s highest average FSI at 0.521, with 80% of its map units rated Fragile or higher; these desert soils possess low organic matter, sparse vegetation, and high sand or silt content. Arizona follows closely with an average FSI of 0.495, where 77% of map units are Fragile or higher, driven by Sonoran and Chihuahuan Desert soils that combine minimal cohesion with rapid wetting-drying cycles. Utah's average FSI of 0.41 sees 62% of its map units rated Fragile or higher, including silty Aridisols with massive structures prone to collapse upon wetting.
For land managers and urban planners, accurately identifying these fragile zones prevents costly infrastructure failures. Building a foundation on unrecognized shrink-swell clays, common in gilgai-prone areas, or developing critical infrastructure over unmapped playa basins prone to salinization and structural collapse, can lead to catastrophic damage. In Phoenix, rapid urban expansion into areas with poorly resolved Aridisols has led to unanticipated foundation settlement, costing millions. Farther north, pipeline operators crossing western Utah's expansive, silty Aridisols face increased integrity risks from unmapped high fragility areas, where subsidence could compromise pipe stability, leading to spills and penalties.
Terrain Derivative Accuracy — Predicting SSURGO Drainage Class
| State / Region | Accuracy (%) |
|---|---|
| Random Forest (all derivatives) | 83% |
| Topographic Wetness Index | 79% |
| Geomorphon + TWI | 76% |
| Slope Position Index | 68% |
| Profile Curvature | 62% |
| Slope Angle Only | 44% |
| Legacy SSURGO Polygon | 71% |
The Regional Picture
Lab10YR integrates LiDAR-derived DEMs with SSURGO and KSSL laboratory data to refine soil interpretations, providing a granular view of soil variability that traditional mapping misses. We join SSURGO data via `mukey` to `component` and `cofrag` tables, identifying areas where subtle elevation changes signify a shift from a stable soil to one with high fragility. This informs everything from pipeline routing to conservation easement prioritization.
Understanding the true extent of soil fragility, revealed by precise terrain mapping, transforms risk assessment into a strategic advantage, protecting investments and ensuring sustainable land use.
Fragile Soil Index Across America