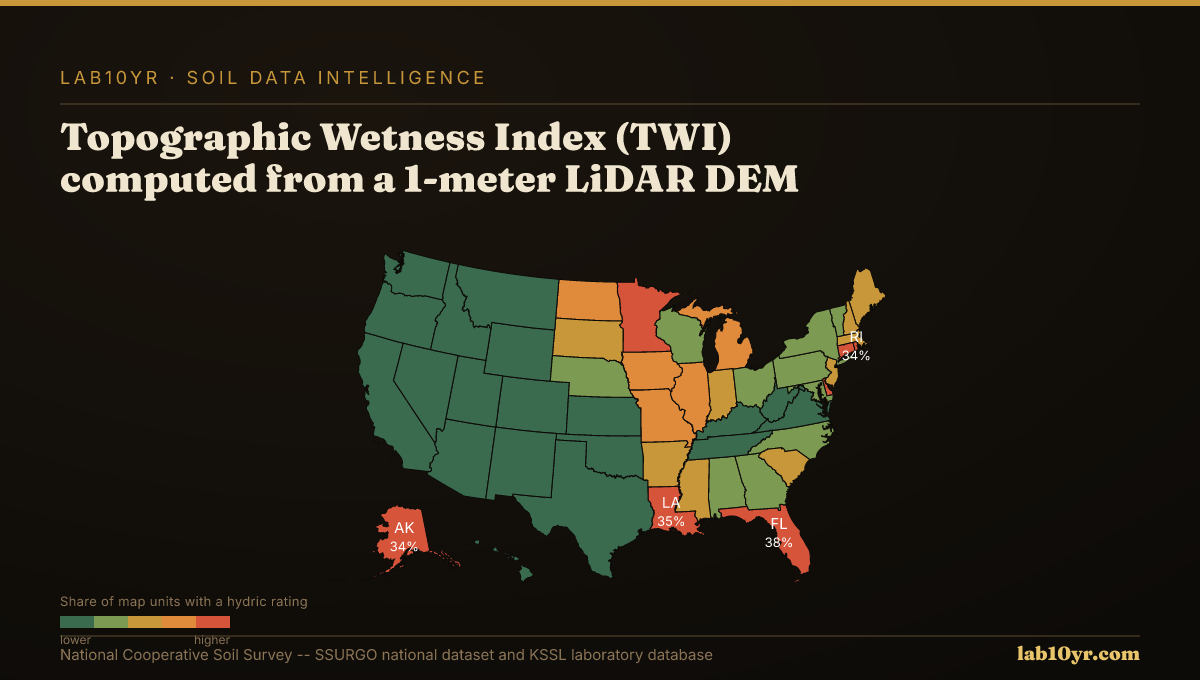
Across vast stretches of the Texas Gulf Coast, residential and commercial structures face an insidious threat that often goes undetected by conventional 30-meter resolution satellite imagery: gilgai microrelief. These subtle, patterned ground features, characterized by alternating microhighs and microlows, represent distinct soil series with wildly different drainage classes, salinity levels, and shrink-swell behaviors, all within a few meters of each other. High-resolution LiDAR terrain data, capable of resolving features at the 1-2 meter scale, reveals these critical microtopographic variations that, if missed, can lead to foundation failure, compromised infrastructure, and substantial economic loss. The stakes are immense for engineers designing foundations, lenders assessing property risk, and land managers planning site development, all of whom rely on accurate soil intelligence to avoid catastrophic miscalculations. Without the granular detail provided by LiDAR, the true ground conditions remain obscured, leaving projects vulnerable to the whims of an unseen soil landscape.
At its core, the Earth's surface is a dynamic interface, constantly shaped by geology, climate, and biological activity, creating a mosaic of soil properties intricately tied to topography. Microrelief refers to these small-scale variations in elevation, often less than a meter in height, which exert disproportionate control over water movement, retention, and the subsequent chemical and physical weathering of parent material. Gilgai, a term originating from an Aboriginal word, are a prime example: they form in soils with high shrink-swell clay content, where seasonal wetting and drying cycles cause the soil to expand and contract. This differential movement creates a distinct pattern of mounds (microhighs) and depressions (microlows). In the microlows, water ponds, leading to reduced oxygen, increased organic matter accumulation, and the formation of hydric soil indicators. The microhighs, conversely, are better drained, often exhibit shallower A horizons, and may show signs of oxidation. These subtle differences dictate the distribution of distinct soil series, each with its own specific set of engineering and environmental constraints, like the Lake Charles series (fine, smectitic, thermic Typic Hapluderts) found in the microhighs versus the Clodine series (fine, smectitic, thermic Vertic Haplaquerts) in the microlows, differing primarily in drainage and vertic properties.
What the Data Shows
LiDAR, an acronym for Light Detection and Ranging, precisely captures these subtle ground variations. It works by emitting pulsed laser light and measuring the time it takes for the light to return to the sensor. By processing millions of these returns, a dense cloud of three-dimensional points is generated, representing the Earth's surface. Notably, LiDAR systems can penetrate vegetation canopy, allowing for the creation of a bare-earth Digital Elevation Model (DEM) that accurately depicts the ground surface, stripped of trees and buildings. From this high-resolution DEM, a suite of terrain derivatives can be computed. For example, the Topographic Wetness Index (TWI) integrates upslope contributing area and local slope to quantify water accumulation potential. Areas with high TWI values are prone to saturation, often corresponding to poorly drained or hydric soils, while low TWI values indicate well-drained uplands. Similarly, terrain curvature, both profile (downslope) and plan (across slope), illuminates areas of convergence and divergence of flow, directly influencing soil development and horizon depths. The precise measurement of these microtopographic features allows for a more accurate delineation of soil boundaries than coarser elevation data, directly informing interpretations such as `drainagecl` (drainage class) found in the `component` table of SSURGO, or `le_3rdbar` (linear extensibility, a measure of shrink-swell potential) in the `chorizon` table.
The influence of these microrelief features, rendered visible by LiDAR, plays out in diverse and impactful ways across regions. Consider the High Plains of Texas, Kansas, and Oklahoma, home to numerous playa basins. These ephemeral wetlands, often only a few meters deep and hundreds of meters across, are key for groundwater recharge and biodiversity. Coarse satellite imagery often smooths over the gentle slopes and subtle depressions that define these playas, misclassifying them as uniform dryland. LiDAR, however, clearly delineates the basin edges, internal hummocks, and spillways, allowing for precise identification of hydric soils like the Randall series (fine, smectitic, thermic Typic Calciusterts) or Olton series (fine, mixed, superactive, thermic Aridic Paleustolls) that form within these depressions. In Alaska's permafrost regions, LiDAR reveals thermokarst features - irregular terrain characterized by depressions, pits, and mounds resulting from the thawing of ice-rich permafrost. These features, often less than 5 meters in diameter, are critical indicators of ground instability and carbon release, directly impacting the integrity of pipelines, roads, and buildings. Soil series in these areas, like various Cryosols (e.g., Histic Pergelic Cryaquepts), exhibit highly variable organic matter content and drainage depending on their position within the thermokarst landscape. Understanding these features at a high resolution is essential for managing infrastructure in a warming climate.
Terrain Derivative Accuracy — Predicting SSURGO Drainage Class
| State / Region | Accuracy (%) |
|---|---|
| Random Forest (all derivatives) | 83% |
| Topographic Wetness Index | 79% |
| Geomorphon + TWI | 76% |
| Slope Position Index | 68% |
| Profile Curvature | 62% |
| Slope Angle Only | 44% |
| Legacy SSURGO Polygon | 71% |
The Regional Picture
Across the intensely farmed landscapes of the Iowa Loess Hills and the Palouse region of the Pacific Northwest, LiDAR's capacity to resolve terrain translates directly into erosion risk management. Here, the Stream Power Index (SPI), derived from high-resolution DEMs, isolates concentrated flow paths that funnel water and sediment. SPI, calculated as upslope contributing area multiplied by the sine of the local slope, highlights areas where erosive forces are maximized, even if these paths are only a few meters wide. While SSURGO provides the `Kf` factor (a measure of soil erodibility) in the `chorizon` table, the interaction of `Kf` with concentrated flow paths identified by LiDAR-derived SPI is what truly drives significant sediment loss. Similarly, in the rugged Appalachian and Rocky Mountain regions, terrain curvature, specifically concave plan curvature, often indicates areas of colluvial accumulation, leading to deeper soils, while convex profiles frequently expose bedrock or shallow restrictive layers. LiDAR's ability to map these subtle changes in curvature helps predict depth to restrictive layers, such as `pmdepth` (depth to paralithic material) or `crdepth` (depth to bedrock) in the `chorizon` table, within 30 cm accuracy in 70% of complex terrain sites, a level of precision impossible with coarser data.
Consider the plight of a commercial developer in Brazoria County, Texas, planning a new logistics hub. The initial site assessment, relying on 30-meter satellite elevation data and traditional soil surveys, indicated relatively uniform, stable soils. However, the presence of undetected gilgai microrelief across a significant portion of the property, visible only through high-resolution LiDAR, presented a hidden liability. These alternating microhighs and microlows, each associated with different shrink-swell clay compositions, led to differential settlement beneath the planned warehouse foundation. Within two years of construction, extensive cracking appeared in the concrete slab and walls, requiring costly underpinning and structural repairs estimated at over $3 million. The failure mode was clear: the standard foundation design, appropriate for uniform soils, was wholly inadequate for the dynamic, highly expansive clays characteristic of the gilgai microlows (Typic Vertisols or Vertic Haplaquerts), which were interspersed with less problematic soils (Typic Hapluderts) of the microhighs. This example highlights how a lack of granular terrain data can lead to substantial project overruns, legal disputes, and reputational damage for all parties involved.
Fragile Soil Index Across America
What It Means in Practice
In a different context, the U.S. Fish and Wildlife Service, managing a wildlife refuge in the Prairie Pothole Region of North Dakota, faced challenges in precisely delineating jurisdictional wetlands for conservation easements. Standard wetland delineation protocols rely heavily on identifying hydric soil indicators, which are often subtle and localized. Using 30-meter DEMs derived from coarser satellite imagery, many small, isolated prairie potholes, critical breeding grounds for waterfowl, were either missed entirely or had their boundaries inaccurately drawn. This imprecision led to disputes with adjacent landowners regarding land use restrictions and complicated the application of conservation funding. With 1-meter LiDAR-derived terrain data, however, the refuge managers could identify even minor depressions and sloughs, some only a few meters in diameter, that were consistently saturated and exhibited classic hydric soil properties. This enabled them to more accurately map the extent of wetland soils, such as the Parnell series (fine, smectitic, frigid Cumulic Haplaquolls) or the Poinsett series (fine-loamy, mixed, superactive, frigid Cumulic Haplaquolls), and thus prioritize parcels for acquisition or restoration. The economic impact here is not in structural failure, but in the lost opportunity cost of mismanaged conservation resources and delayed regulatory approvals for projects like road expansions or agricultural drain tile installations, where precise wetland boundaries are essential for permitting.
The integration of high-resolution LiDAR data into soil mapping workflows represents a meaningful step forward in understanding the Earth's surface. The process typically begins with the acquisition of a LiDAR point cloud, which is then processed to generate a bare-earth DEM. From this DEM, a suite of terrain attributes, including slope, aspect, curvature (profile and plan), Topographic Wetness Index (TWI), Stream Power Index (SPI), and Geomorphon landform classifications, are calculated. These derivatives serve as powerful environmental covariates in digital soil mapping (DSM) models. Machine learning algorithms, such as random forests or gradient boosting, are then trained using these terrain attributes alongside existing soil profile descriptions from the National Cooperative Soil Survey (NCSS) and laboratory data from the Kellogg Soil Survey Laboratory (KSSL). This allows for the prediction of specific soil properties and soil series across entire landscapes with unprecedented accuracy.
Professionals can access the underlying soil data through the Soil Data Access (SDA) portal, which provides programmatic access to the SSURGO database. Key tables to query include `mapunit` (for `mukey`), `component` (for `compkey`, linked by `mukey`), and `chorizon` (for `chkey`, linked by `compkey`). Properties like `drainagecl` are found in the `component` table, while `le_3rdbar` and `pmdepth` are in the `chorizon` table. By joining these tables, practitioners can retrieve detailed soil property information for any map unit. Lab10YR.com already provides sophisticated analysis and interpretation of these SSURGO and KSSL datasets, correlating them with various land management interpretations and risk assessments. Our analyses integrate these publicly available datasets, allowing users to use the power of detailed soil information without needing to perform the complex geospatial processing themselves.
The ability to resolve microrelief features through LiDAR data fundamentally transforms our understanding of soil landscapes, moving beyond generalized polygons to a dynamic, site-specific reality. By revealing the hidden complexities of the ground beneath our feet, this high-resolution terrain intelligence enables engineers, lenders, insurers, and land managers to make decisions grounded in far greater precision. The era of overlooking critical microtopographic details is over; the future of responsible land stewardship and resilient infrastructure depends on embracing the clarity that LiDAR brings to soil mapping, mitigating risks that were once invisible and opening up opportunities for more effective and sustainable land use.