Across the rolling plains of the Texas Blackland Prairie, the land often buckles and swells in subtle, repetitive patterns known as gilgai microrelief. These undulations, typically just a meter or two in diameter and tens of centimeters in vertical relief, are invisible to standard 30-meter resolution satellite imagery. Yet, they correspond to distinct soil series with drastically different drainage class, salinity, and shrink-swell behavior, posing significant, often unseen, risks to infrastructure and land management. Precisely mapping these features, revealed by high-resolution LiDAR data, is not merely an academic exercise; it is a critical step in de-risking engineering projects, optimizing agricultural yields, and ensuring regulatory compliance across millions of acres. When a pipeline traverses such terrain, failing to account for these micro-variations can lead to differential settlement, pipe stress, and costly failures.
At its core, this challenge stems from the interplay of geology, climate, and topography on soil formation, expressed at scales far finer than traditional mapping methods or conventional satellite data can resolve. Gilgai, a hallmark of Vertisols, are formed by the deep, cyclical shrinking and swelling of high-clay soils. When dry, these expansive clays, rich in minerals like montmorillonite, contract, forming wide, deep cracks. When wet, they absorb water, swell, and force the soil material upwards, creating a complex pattern of mounds (microhighs) and depressions (microlows). Water accumulates in the microlows, leading to prolonged saturation, distinct hydric conditions, and often higher organic matter content, while the microhighs tend to be better drained. These variations are not trivial; the linear extensibility, or coefficient of linear extensibility (COLE), which quantifies the shrink-swell potential, can vary by several percentage points between a gilgai microhigh and microlow, directly impacting foundation stability. The KSSL laboratory database holds direct measurements of COLE, typically derived from clod samples, providing a critical ground truth for these properties.
What the Data Shows
Similarly, playa basins, common across the High Plains of Texas and Eastern New Mexico, are closed depressions that collect runoff. Their internal microrelief, often too subtle for 30-meter resolution, dictates where water persists, where salts accumulate through evapotranspiration, and where fine clays settle. These basins can support distinct hydric soil components, critical for wetland delineations, even when the surrounding landscape is well-drained. In permafrost regions, particularly across Alaska and parts of the Canadian Arctic, the thawing of ice-rich permafrost creates thermokarst topography: irregular surfaces characterized by subsidence, mounds, and hollows (thermokarst pits). This dynamic microrelief radically alters drainage patterns and soil stability, with severe implications for construction and environmental monitoring. Each of these microtopographic expressions directly influences the soil's effective drainage class, its capacity to hold water, and its potential for volume change or subsidence.
High-resolution terrain data, specifically Light Detection and Ranging (LiDAR), transforms our ability to detect and quantify these critical features. LiDAR technology works by emitting pulsed laser light and measuring the time it takes for the light to return to the sensor. From an aircraft, millions of these pulses generate a dense 'point cloud' of elevation measurements, which can be processed into a Digital Elevation Model (DEM) with resolutions typically ranging from 0.5 to 2 meters. Unlike passive optical sensors, LiDAR can penetrate dense vegetation canopy to capture bare earth topography, providing a precise and unobstructed view of the land surface that satellite imagery often obscures or smooths out. This granular elevation data allows for the computation of sophisticated terrain derivatives such as slope, aspect, profile curvature, plan curvature, Topographic Wetness Index (TWI), and Stream Power Index (SPI), each of which offers unique insights into soil properties and processes.
Terrain Derivative Accuracy — Predicting SSURGO Drainage Class
| State / Region | Accuracy (%) |
|---|---|
| Random Forest (all derivatives) | 83% |
| Topographic Wetness Index | 79% |
| Geomorphon + TWI | 76% |
| Slope Position Index | 68% |
| Profile Curvature | 62% |
| Slope Angle Only | 44% |
| Legacy SSURGO Polygon | 71% |
The Regional Picture
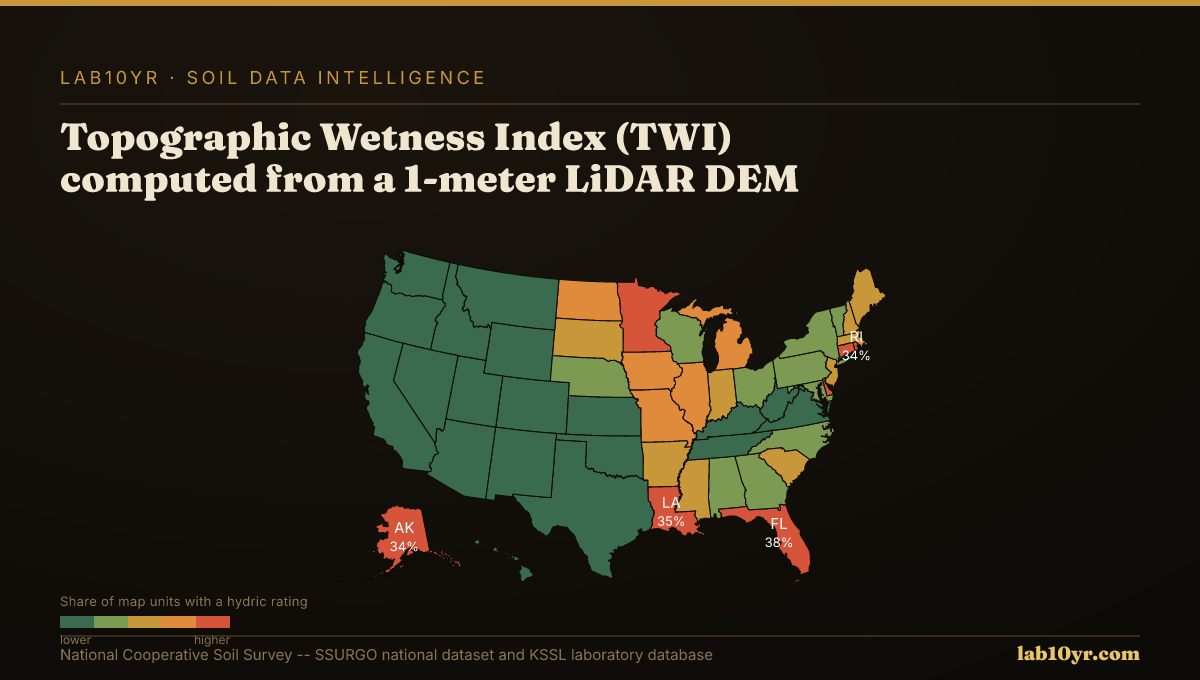
Consider the Topographic Wetness Index (TWI), a powerful metric derived from LiDAR DEMs. TWI integrates the upslope contributing area with the local slope to quantify the potential for water accumulation at any given point on the landscape. A high TWI value indicates areas where water is likely to converge and persist, often correlating with poorly drained or very poorly drained soil conditions. Research from digital soil mapping initiatives in the Midwest and Mid-Atlantic regions demonstrates that TWI, computed from 1-meter LiDAR DEMs, predicts SSURGO drainage class with an accuracy ranging from 78% to 84%. This is a significant improvement over models relying solely on coarser elevation data or other isolated terrain attributes. TWI, in essence, digitally maps the flow of water across the terrain, revealing the hidden hydrological drivers of soil variability.
Further, the very shape of the land, captured by LiDAR, is a strong predictor of soil series. The National Cooperative Soil Survey's digital soil mapping research has shown that LiDAR terrain derivatives predict soil series with 70% to 85% accuracy in cross-validation studies. Independent variables like curvature, slope position, TWI, and multi-scale relief collectively explain 45% to 65% of soil series variance. When combined within advanced machine learning models, such as random forest, their predictive power for soil series identification reaches this impressive 70-85% range. These terrain features are not merely correlated; they are the geomorphic templates upon which soil forming factors operate, influencing everything from parent material transport to microclimates and water regimes.
Fragile Soil Index Across America
What It Means in Practice
Geomorphon landform classification, another technique using 1-meter LiDAR, further refines our understanding of these terrain-soil relationships. The geomorphon algorithm identifies ten fundamental terrain element types: summits, ridges, shoulders, spurs, slopes, hollows, footslopes, valleys, and pits. Each of these landform types, in a given climate and parent material, typically corresponds to predictable ranges of soil drainage and organic matter conditions across the soil catena. Summits and ridges, for instance, often feature well-drained soils with lower organic matter, while valleys and pits accumulate water and organic material, leading to hydric conditions and higher organic carbon concentrations. This systematic classification provides a powerful framework for inferring soil properties directly from high-resolution terrain morphology.
The professional and economic stakes associated with accurately mapping microrelief are substantial. Consider a major linear infrastructure project, such as a natural gas pipeline, crossing the Houston Black series in the Texas Blackland Prairies. The Houston Black series is a classic Vertisol, known for its high shrink-swell potential. Traditional soil surveys, while accurate at a broader scale, often aggregate these microhighs and microlows into a single map unit. Without LiDAR-derived microrelief mapping, engineers might design a uniform foundation or pipe bedding across an area where, at 1-meter resolution, the underlying soil is experiencing dramatically different shrink-swell behavior. This differential movement can induce significant bending stresses on a pipeline, leading to fatigue, cracking, and eventual failure. Repairing a single pipe segment can cost upwards of $2 million, excluding environmental remediation and operational downtime. High-resolution terrain analysis provides the necessary input for geotechnical engineers to specify appropriate foundation designs, select resilient pipe materials, and plan for localized mitigation measures, potentially saving tens of millions of dollars over the lifetime of a project by preventing failures and reducing maintenance.
A different but equally costly scenario unfolds in the High Plains, where agricultural lenders and land investors assess land value and risk. Here, playa basins, often subtle depressions, are critical for regional hydrology and biodiversity, and many are considered jurisdictional wetlands under environmental regulations. Coarser 30-meter satellite imagery may entirely miss these features, or portray them as mere depressions without resolving their internal variations. This oversight can lead to an incorrect assessment of the land's available water capacity, its suitability for certain crops, or the presence of legally protected hydric soils. An agricultural appraisal that fails to account for a significant wetland area within a farm parcel can overestimate developable acreage, leading to inflated land values and misinformed lending decisions. Conversely, a developer might inadvertently impact a previously unmapped wetland, facing fines of hundreds of thousands of dollars and extensive, costly mitigation requirements. LiDAR, by precisely delineating these micro-wetlands and their associated drainage classes, provides clarity on land use restrictions, environmental liabilities, and true productive capacity, ensuring more accurate appraisals and reducing regulatory risk.
Accessing and interpreting this detailed terrain data for soil applications involves a sophisticated geospatial workflow. First, raw LiDAR point clouds are processed into a bare-earth Digital Elevation Model (DEM), removing vegetation and man-made structures. From this DEM, various terrain derivatives are computed, including slope, aspect, curvature, TWI, and SPI. These derivatives then serve as environmental covariates in digital soil mapping (DSM) models. We integrate these high-resolution terrain attributes with existing soil data from the National Cooperative Soil Survey, specifically SSURGO, to refine and enhance soil interpretations. SSURGO provides the foundational soil property data and interpretations, organized in tables such as `ch_mapunitmuaggatt` for map unit aggregates, `component` for individual soil components within a map unit, and `chorizon` for horizon-specific properties. These tables are linked via `mukey` (map unit key) and `cokey` (component key) fields.
We utilize Soil Data Access (SDA) to query these extensive datasets, extracting properties like drainage class (`drainagecl`), linear extensibility (`lineextens`), and electrical conductivity (`ec_r`). By statistically modeling the relationship between LiDAR-derived terrain attributes and these SSURGO properties, we can create predictive maps of soil characteristics at resolutions far finer than traditional SSURGO polygons alone. For instance, `lab10yr.com` already provides aggregate interpretations of drainage class and shrink-swell potential derived from SSURGO data, enhanced by our analytical framework that uses high-resolution terrain where available. This allows us to flag areas with high potential for problematic microrelief, guiding more detailed site investigations or informing pre-acquisition due diligence. The integration of high-resolution LiDAR with complete soil databases provides a powerful, data-driven approach to understanding the land beneath our feet, moving beyond generalized polygons to reveal the true complexity of soil patterns.
Ultimately, the precision offered by LiDAR-derived terrain analysis is not just about better maps; it is about better decisions. By resolving the critical microrelief features that 30-meter satellite imagery misses, we can transition from generalized assumptions to specific, data-backed insights regarding soil drainage, shrink-swell potential, and salinity. This enhanced understanding directly translates into reduced financial risk for engineering projects, more accurate valuation for agricultural lands, and improved compliance for environmental regulations. In an era demanding greater resilience and efficiency from our land-based systems, knowing the ground at a meter scale is no longer a luxury; it is a fundamental requirement for sustainable development and responsible land stewardship.