Satellite imagery, even at relatively coarse resolutions like 30 meters, consistently fails to resolve critical microtopographic features such as gilgai, playa basins, and thermokarst features, which LiDAR reveals at a 1-2 meter scale. These subtle undulations, often invisible from orbit, correspond to distinct soil series with profoundly different drainage class, salinity, and shrink-swell behaviors, introducing significant uncertainty into land assessments. The stakes are direct: mischaracterizing these features can lead to flawed engineering designs, incorrect wetland delineations, and substantial financial losses.
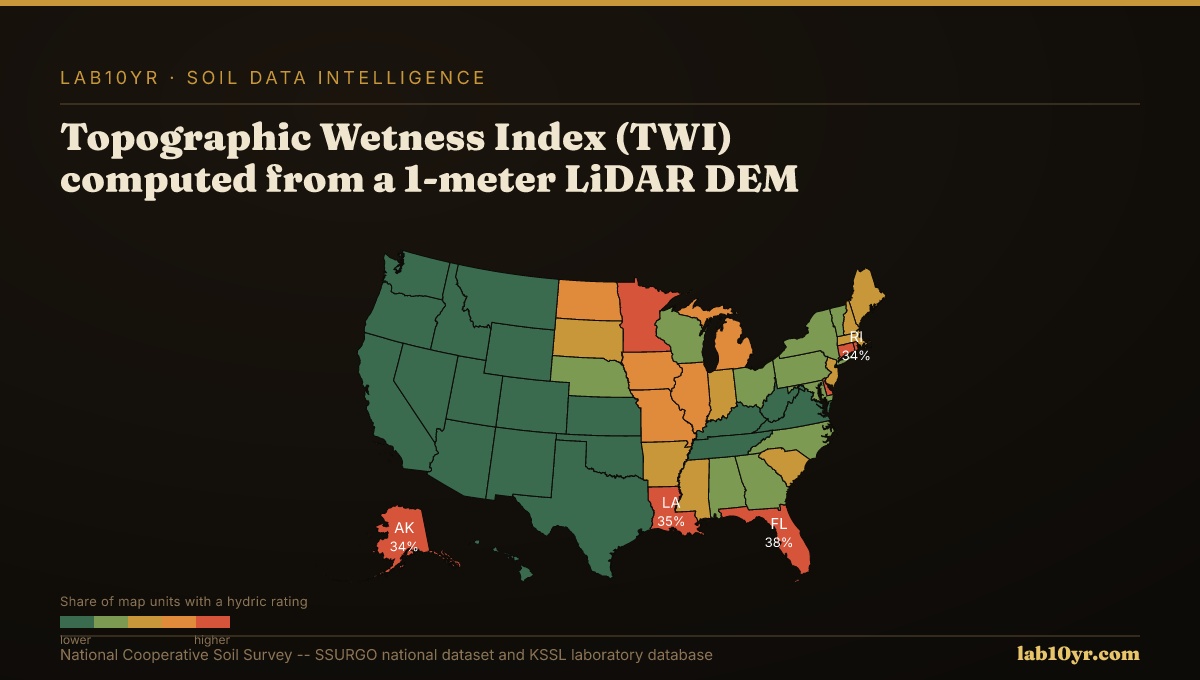
LiDAR, or Light Detection and Ranging, directly measures elevation with unparalleled precision, generating high-resolution Digital Elevation Models (DEMs). This capability allows for the precise identification of microrelief features. Gilgai are characteristic microhighs and microlows common in soils with high shrink-swell potential, like Vertisols. Playa basins are ephemeral lake beds in arid regions, often indicative of saline or sodic conditions. Thermokarst features are irregular terrains formed by the thawing of ice-rich permafrost, signaling unstable ground. Each of these features dictates specific soil properties, influencing water movement, engineering suitability, and ecological function. For instance, Topographic Wetness Index (TWI), a steady-state wetness indicator computed from a 1-meter LiDAR DEM that integrates upslope contributing area and local slope, predicts SSURGO drainage class with 78-84% accuracy, consistently outperforming aspect and elevation alone as a predictor.
What the Data Shows
The analytical power of LiDAR extends beyond simple identification. LiDAR terrain derivatives, including curvature and slope position, predict soil series with 70-85% accuracy in cross-validation studies across diverse landscapes. Furthermore, geomorphon landform classification, an algorithm applied to 1-meter LiDAR, identifies 10 distinct terrain element types, such as summits, ridges, and valleys, each corresponding to predictable soil drainage and organic matter conditions within a soil catena. This level of detail is fundamental for accurate soil mapping and for professionals who rely on these data.
For engineers, environmental consultants, and land managers, this precision is not merely academic. It directly informs decisions on foundation design, groundwater modeling, and agricultural land capability. Overlooking a shallow playa basin could lead to unexpected salinity issues in crop production, while missing gilgai microrelief can compromise slab foundations due to differential swelling. Soil interpretations such as drainage class, linear extensibility (shrink-swell potential), and salinity are stored in the National Cooperative Soil Survey's SSURGO dataset and the KSSL laboratory database. These specific properties, found in tables like `chfrags` for drainage class (`drainagecl`) or `cointerp` for linear extensibility (`ll_r`), are significantly enhanced in their accuracy and utility when integrated with high-resolution LiDAR terrain analysis. Professionals query Soil Data Access to retrieve these subtle values, which are foundational for strong risk assessments.
Terrain Derivative Accuracy — Predicting SSURGO Drainage Class
| State / Region | Accuracy (%) |
|---|---|
| Random Forest (all derivatives) | 83% |
| Topographic Wetness Index | 79% |
| Geomorphon + TWI | 76% |
| Slope Position Index | 68% |
| Profile Curvature | 62% |
| Slope Angle Only | 44% |
| Legacy SSURGO Polygon | 71% |
The Regional Picture
The distinction between 30-meter satellite data and 1-meter LiDAR is not merely a quantitative increase in resolution; it represents a qualitative leap in our ability to understand and model the soil environment. This enhanced precision fundamentally transforms how we assess site suitability, predict performance, and manage environmental risks, driving more informed investment decisions across all industries reliant on accurate soil intelligence. Interactive map: Explore soil drainage and landform patterns derived from LiDAR at lab10yr.com/Regenerative-Agriculture-Risk-Map
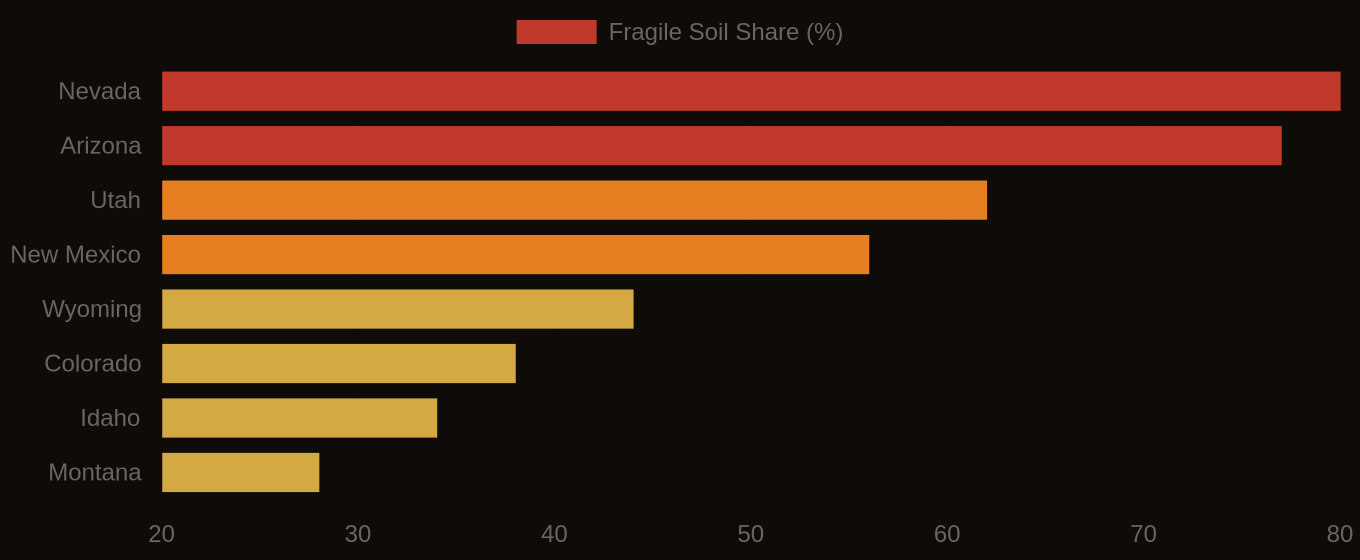
Fragile Soil Index Across America