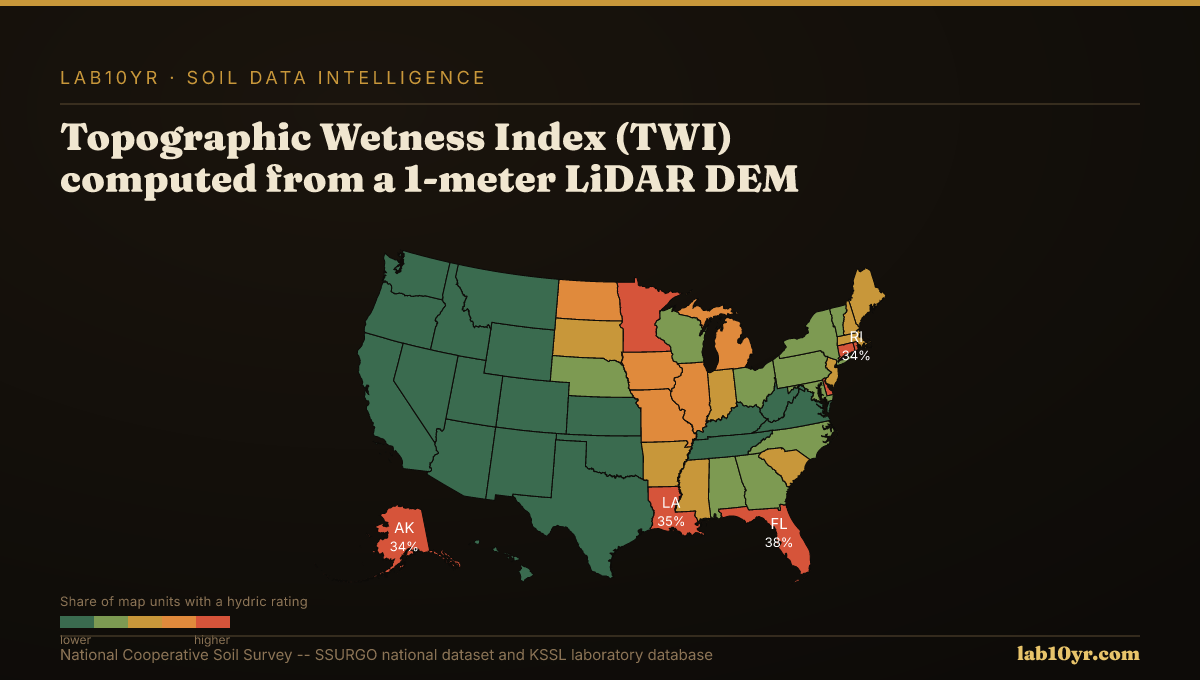
LiDAR reveals gilgai microrelief, playa basins, and thermokarst features at the 1-2 meter scale that 30-meter satellite imagery cannot resolve, each corresponding to distinct soil series with critical differences in drainage class, salinity, and shrink-swell behavior.
This enhanced resolution stems from LiDAR's active sensing approach: it emits pulsed laser light, measuring the precise time for the light to return to the sensor, thereby generating a dense cloud of three-dimensional points. These points are then processed to create high-resolution digital elevation models (DEMs), effectively seeing through vegetation canopy to map the bare earth's surface topography with unprecedented detail. Unlike passive satellite imagery, which captures reflected sunlight at lower spatial resolutions, LiDAR provides true vertical accuracy and micro-topographic feature detection key for subtle soil mapping.
What the Data Shows
From these detailed DEMs, we derive terrain attributes that directly inform soil interpretations. The Topographic Wetness Index (TWI), for example, computed from 1-meter LiDAR DEMs, predicts SSURGO drainage class with 78-84% accuracy in digital soil mapping research. TWI integrates upslope contributing area and local slope to quantify water accumulation potential, offering a far more accurate predictor than aspect or elevation alone. Similarly, geomorphon landform classifications, also derived from 1-meter LiDAR, identify 10 distinct terrain element types like summits, ridges, and hollows that predictably correspond to specific soil drainage and organic matter conditions across a soil catena.
LiDAR terrain derivatives collectively predict soil series with 70-85% accuracy in cross-validation studies conducted by the National Cooperative Soil Survey. Curvature, slope position, TWI, and multi-scale relief independently explain 45-65% of soil series variance; combined in a random forest model, they reach 70-85%. Terrain curvature, specifically profile and plan curvature, predicts depth to a restrictive layer within 30 cm accuracy in 70% of complex terrain sites in regions like the Appalachians, where concave plan curvature often indicates accumulated colluvium and deeper soils. Furthermore, the Stream Power Index (SPI), calculated from high-resolution terrain, isolates 8-15% of watershed area responsible for 55-70% of measured sediment production in areas such as the Iowa Loess Hills, identifying concentrated flow paths where SSURGO Kf factors and slope interact to maximize erosion potential.
Terrain Derivative Accuracy — Predicting SSURGO Drainage Class
| State / Region | Accuracy (%) |
|---|---|
| Random Forest (all derivatives) | 83% |
| Topographic Wetness Index | 79% |
| Geomorphon + TWI | 76% |
| Slope Position Index | 68% |
| Profile Curvature | 62% |
| Slope Angle Only | 44% |
| Legacy SSURGO Polygon | 71% |
The Regional Picture
Misidentifying these micro-scale features carries substantial economic risk. In the playa lakes region of the Southern High Plains, missing a critical playa basin with 30-meter satellite imagery can lead to incorrect wetland delineations, resulting in multi-million dollar regulatory fines for agricultural operations and energy infrastructure projects.
Across the glaciated plains of North Dakota, ignoring the subtle depressional features indicative of thermokarst collapse can result in the mis-siting of pipelines and roads, triggering costly infrastructure failures and environmental remediation exceeding seven-figure sums when the underlying unstable soils are disturbed.
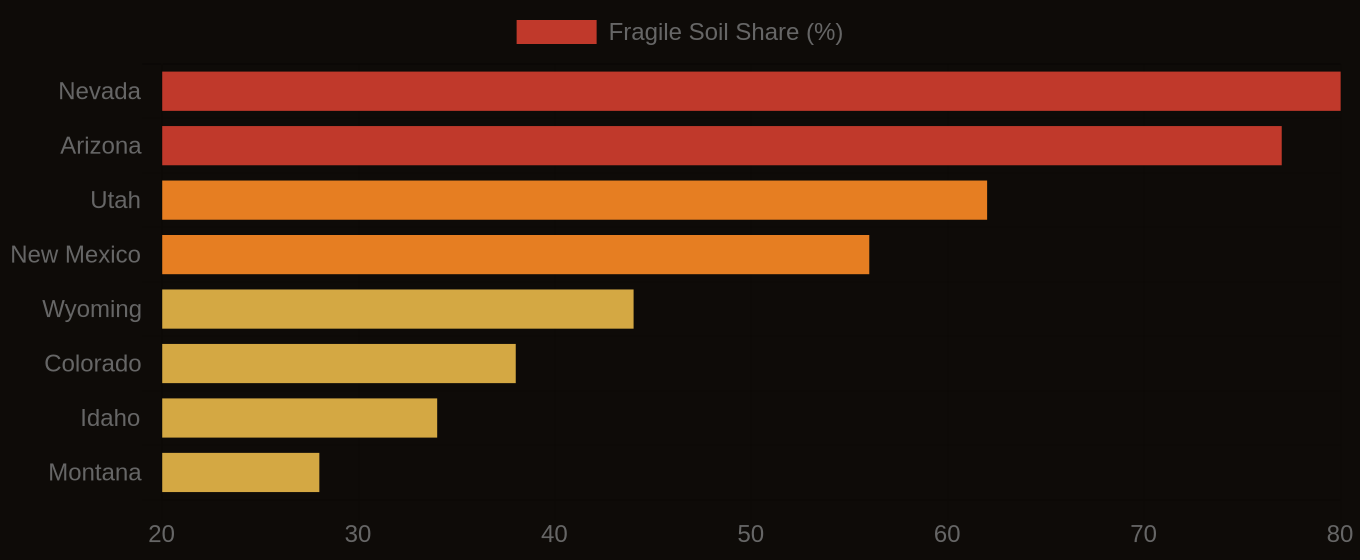
Fragile Soil Index Across America
What It Means in Practice
Professionals can access these high-resolution terrain derivatives through Soil Data Access queries that integrate KSSL laboratory data with SSURGO map unit attribute tables. We use advanced geospatial processing of public domain LiDAR data to generate these enhanced terrain products, connecting them directly to the `chkey` and `cokey` fields in the `component` and `chorizon` tables to improve existing SSURGO interpretations, which Lab10YR already features in our enhanced soil intelligence platform.
The ability to resolve soil features at the meter scale changes how we understand and manage land. It moves us from broad generalizations to precise, data-driven decisions, offering a clearer picture of the ground beneath our feet.