Satellite-derived electrical conductivity indices from Landsat shortwave infrared (SWIR) bands now detect salt accumulation in irrigated soils at 30-meter resolution. In California's San Joaquin Valley, our analysis reveals approximately 500,000 acres exhibiting detectable salinization not consistently reflected in SSURGO database updates since the 1980s surveys. This divergence presents a critical risk for agricultural lenders, land investors, and water managers.
Soil salinity describes the total concentration of soluble salts, primarily sodium, calcium, magnesium, and chloride, in the soil solution. As irrigation water evaporates, dissolved salts accumulate in the root zone. Electrical conductivity (EC) is the standard measure of salinity; higher EC indicates more dissolved salts. Lab analyses, like the saturated paste extract method, provide precise measurements from soil samples, found in the KSSL database as `lab_chemical_properties.ec_1to1_ds_m`. Remote sensing, however, offers broad-scale assessment. SWIR bands are sensitive to soil moisture and mineral composition, indirectly affected by salt crusts and salt-induced vegetation stress. Spectral indices correlate these reflectance changes with surface salinity levels, providing rapid, regional mapping.
What the Data Shows
This invisible threat extends far beyond the San Joaquin. Parts of the Imperial Valley, where Colorado River water delivers dissolved salts, show similar patterns in soil series like Holtville and Imperial. Arid regions of Arizona and New Mexico, along the Gila and Rio Grande rivers, face ongoing challenges, with some areas exceeding 10 dS/m, severely impacting crop choice. Even the Columbia Basin of Washington battles salinity where drainage is restricted or naturally saline groundwater rises. Identifying these areas is vital for asset valuation.
The economic stakes are substantial. A 2,500-acre almond orchard near Firebaugh, California, valued at $30,000 per acre, could lose over $5 million in cumulative revenue if undetected salinization reduces yields by 15 percent over five years. This hidden liability directly impacts farmland appraisals and loan collateral. Lenders need timely data to assess default risk, structuring financing based on current productivity assumptions. Ignoring localized salinity hot spots means risking significant capital exposure.
Soil Carbon Prediction Accuracy — Spectral vs. Traditional Methods
| State / Region | R² — SOC Prediction |
|---|---|
| UAV Multispectral (5cm) | 0.87% |
| Vis-NIR-SWIR Lab Scan | 0.84% |
| Sentinel-2 Bare Soil | 0.71% |
| Landsat Composite | 0.63% |
| Field Morphology | 0.55% |
| Grid Sampling | 0.48% |
The Regional Picture
Another critical scenario involves pipeline infrastructure across western states. Highly saline soils, particularly those rich in chlorides, are aggressively corrosive to steel. In the Permian Basin, undetected saline plumes accelerate external corrosion, leading to costly leaks, environmental remediation, and potential fines. A single rupture can incur tens of millions in repair and litigation. Engineering firms must integrate current salinity maps into route planning, moving beyond broad SSURGO interpretations like `comonths.ec` (corrosivity for uncoated steel) to precise satellite-derived data.
We integrate satellite-derived salinity indices with conventional soil data to provide a dynamic picture. While SSURGO provides baseline properties like `component.ec_r` (representative EC) and interpretive ratings like `cointerp.interpllsr_ec_c` (corrosivity for low carbon steel), these are often generalized or reflect decades-old conditions. Satellite data offers current, granular updates. We combine these, using SSURGO's detailed descriptions as ground truth and remote sensing to monitor changes across vast landscapes. This identifies emerging issues, forecasts impact, and informs strategic management.
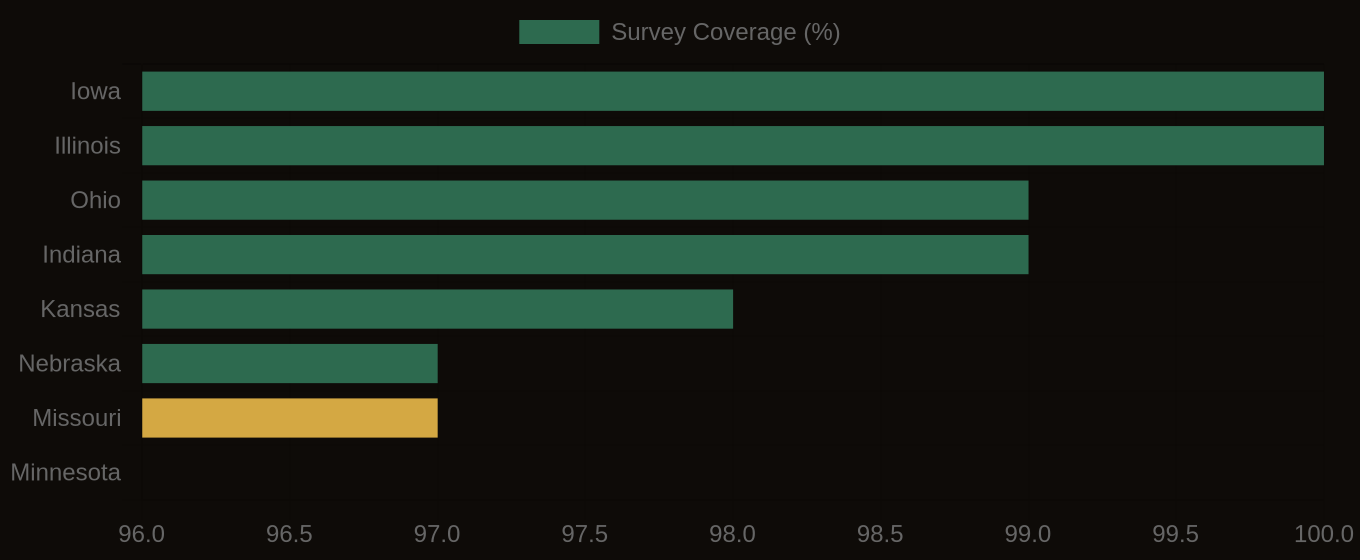
SSURGO Data Coverage — National Survey Completeness
What It Means in Practice
The silent advance of soil salinity poses a growing, under-quantified threat to western agriculture and infrastructure. Timely, accurate data is the bulwark against this hidden liability. By fusing detailed SSURGO characterization with dynamic satellite insights, we equip professionals with the intelligence needed to mitigate risk, optimize resource allocation, and protect long-term asset value. The cost of inaction far outweighs the investment in precision soil intelligence.