Stream Power Index, computed from upslope area and slope gradient, predicts active rill and gully erosion with stronger spatial accuracy than RUSLE slope alone. In the Iowa Loess Hills, SPI isolates the 8% of field area generating 60% of the sediment load, a precise tool for targeted conservation.
This terrain derivative quantifies the erosive power of concentrated water flow. Stream Power Index (SPI), calculated as upslope contributing area multiplied by the sine of local slope, identifies channels where water accumulates and gains velocity. Unlike simplified slope factors, SPI captures how water accelerates across convergent topography, revealing precise flow paths driving significant soil loss. This accounts for interaction between a soil's inherent erodibility (SSURGO Kf factor) and the energy of flowing water.
What the Data Shows
Understanding these high-energy flow paths is critical for infrastructure and land use. Beyond the Iowa Loess Hills, research in the Palouse shows SPI pinpoints the 15% of a watershed responsible for 70% of its measured sediment production. This precise mapping allows watershed engineers to prioritize interventions, from contour farming to check dams, in the most impactful locations.
The economic implications are substantial for infrastructure risk managers and precision agriculture consultants. Unmitigated rill and gully erosion leads to significant costs: sediment removal from culverts, compromised road stability, reduced agricultural productivity. By identifying high-risk areas, SPI enables engineers to design structures like energy dissipators where most needed, extending asset life and avoiding costly emergency repairs. Conservation planners can direct limited resources to the most vulnerable acres, maximizing impact on water quality and soil retention.
Terrain Derivative Accuracy — Predicting SSURGO Drainage Class
| State / Region | Accuracy (%) |
|---|---|
| Random Forest (all derivatives) | 83% |
| Topographic Wetness Index | 79% |
| Geomorphon + TWI | 76% |
| Slope Position Index | 68% |
| Profile Curvature | 62% |
| Slope Angle Only | 44% |
| Legacy SSURGO Polygon | 71% |
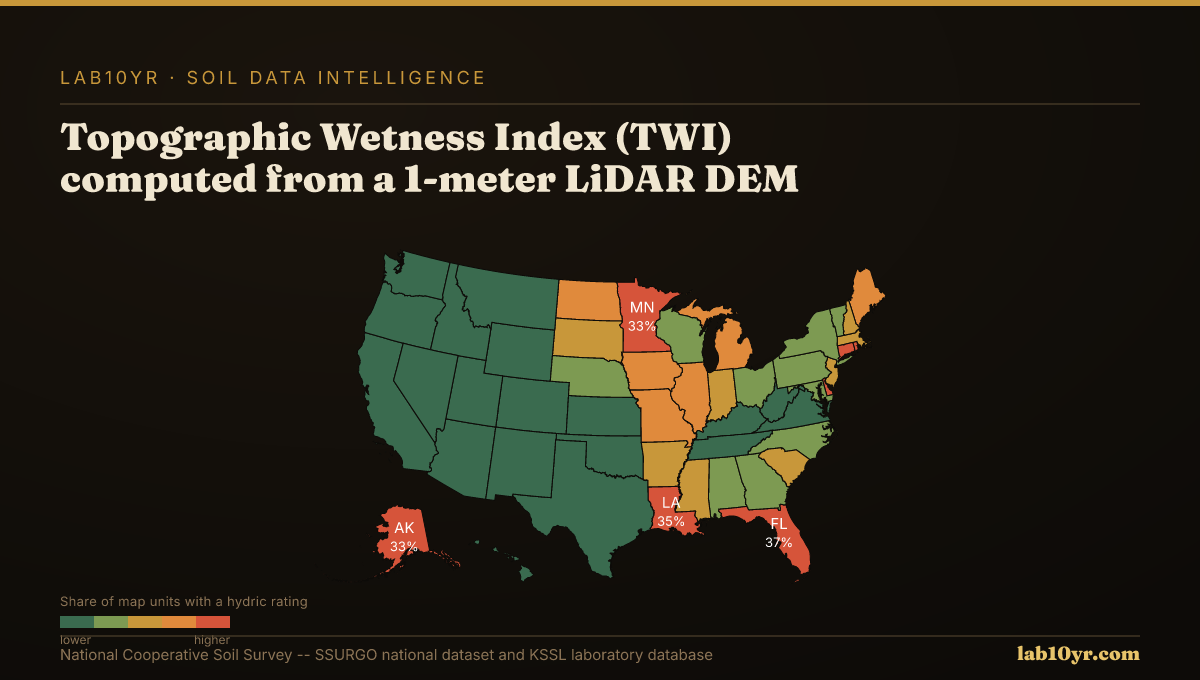
The Regional Picture
We calculate these terrain derivatives, including Stream Power Index, from high-resolution 1-meter LiDAR Digital Elevation Models (DEMs). This geospatial analysis integrates with property data from the National Cooperative Soil Survey, via Soil Data Access, covering SSURGO and KSSL laboratory databases. Lab10YR.com provides these interpretations to reveal hidden risks and opportunities across vast land areas.
Targeted interventions based on SPI provide a strategic advantage for land managers. Investing in preventative measures where erosive energy is highest protects long-term land value and ecological function. This moves beyond broad-brush approaches to data-driven precision in conservation and engineering.
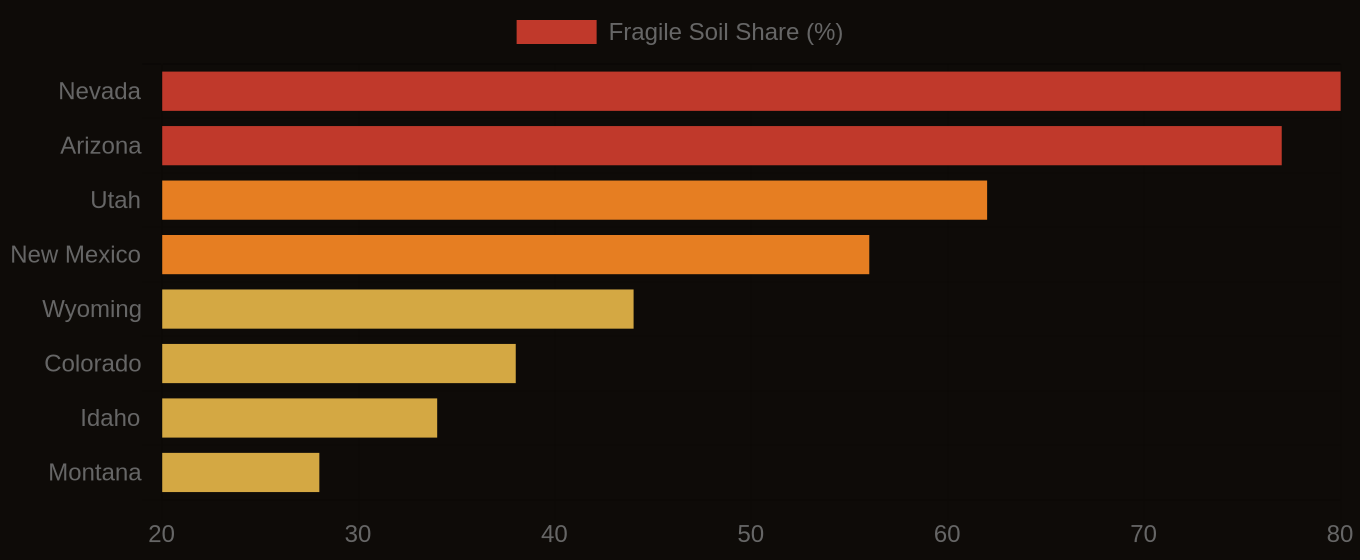
Fragile Soil Index Across America