Farmland investors look at capitalization rates and historical yields. The critical data they often overlook is the slope, curvature, and upslope contributing area of the land itself. These topographic attributes, invisible on a survey plat, are fundamental drivers of soil performance and long-term asset value.
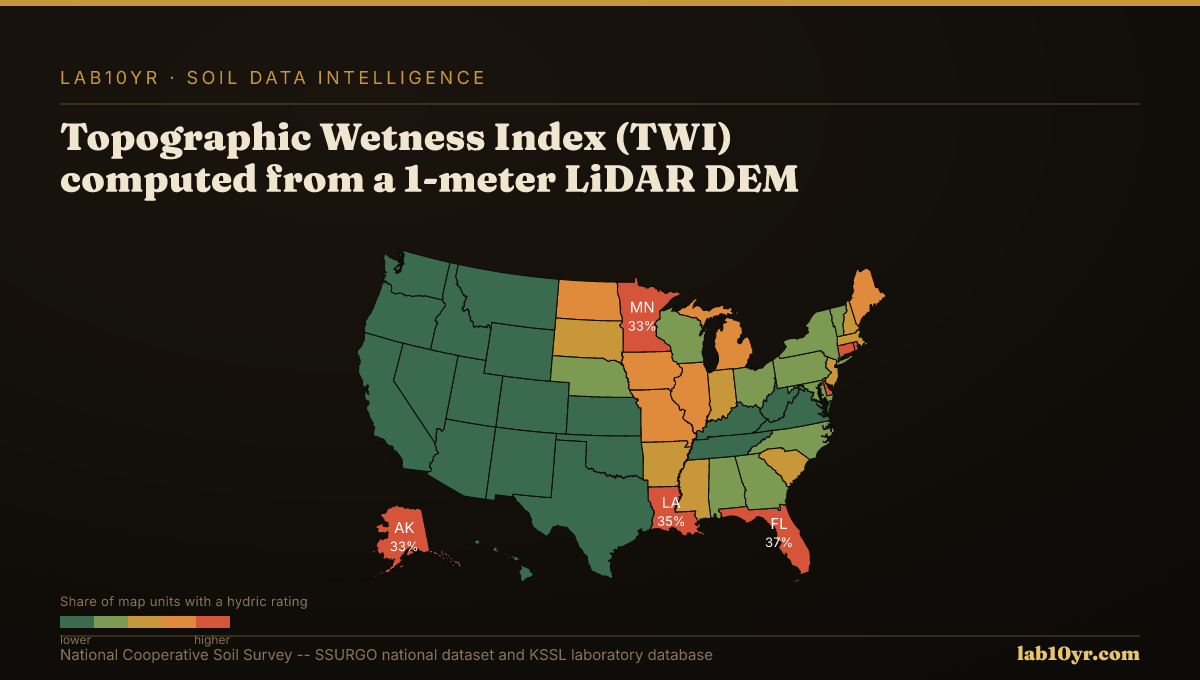
Soil properties, directly affecting productivity, drainage, and erosion, are powerfully shaped by terrain. The Topographic Wetness Index (TWI), derived from high-resolution LiDAR digital elevation models (DEMs), predicts SSURGO drainage class with 78-84% accuracy in Midwest and Mid-Atlantic agricultural lands. TWI quantifies water accumulation potential by integrating local slope and upslope contributing area, offering a precise understanding of hydric conditions. Similarly, geomorphon landform classifications, also from 1-meter LiDAR, identify ten distinct terrain element types. These--summits, ridges, footslopes--each carry predictable ranges of soil drainage and organic matter content across the soil catena, providing field-scale insight into soil variation.
What SSURGO Reveals
Terrain also governs erosion and soil depth. The Stream Power Index (SPI), calculated as upslope area multiplied by the sine of the slope, isolates concentrated flow paths where soil loss is highest. Watershed erosion research in the Iowa Loess Hills and Palouse showed that 8-15% of a watershed's area, identified by high SPI, can be responsible for 55-70% of measured sediment production. This pinpoints where the SSURGO Kf factor, quantifying soil erodibility, interacts with concentrated flow. Furthermore, terrain curvature, specifically profile and plan curvature, predicts depth to restrictive layers, like bedrock, within 30 cm accuracy in 70% of complex terrain sites in validation studies. Concave plan curvature correlates with deeper, more productive soils; convex profiles indicate shallower conditions.
This detailed terrain intelligence provides critical context for financial decisions. It refines yield projections by identifying areas prone to waterlogging or drought, quantifies erosion risk for conservation easements, and flags sites with shallow soils impacting infrastructure. We compute these terrain derivatives from publicly available 1-meter LiDAR DEMs, integrating them with interpretations from the SSURGO national dataset and KSSL laboratory database. This allows lenders, investors, and brokers to move beyond generalized soil maps to a granular understanding of individual parcels. With 315,543 map units in the SSURGO national dataset, and 13.3% of rated map units carrying a Fragile or higher Fragile Soil Index rating, terrain intelligence illuminates the localized risks and opportunities embedded in farmland assets. It transforms due diligence into a precision analysis of the land's inherent capabilities.
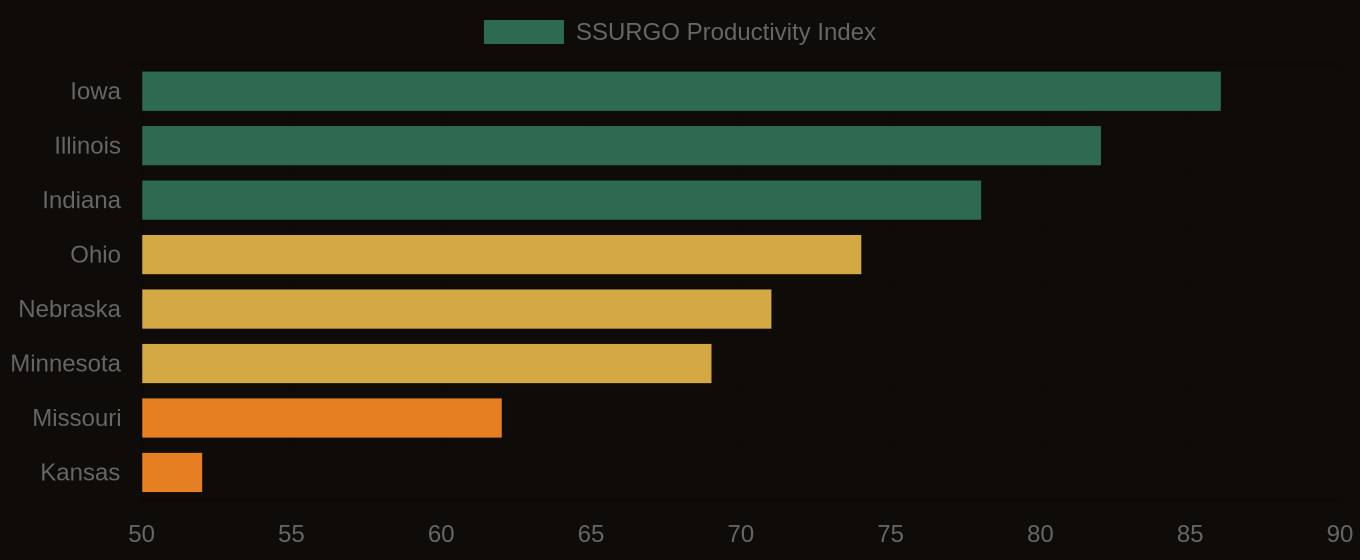
Soil Productivity Index vs. Cash Rent — Corn Belt States
States at Greatest Risk
Soil Productivity Index — Farmland Investment Map