A soil with 10 inches of available water capacity can carry a corn crop through two additional weeks of drought compared to a soil with 4 inches. That difference is already in SSURGO for every field in the Corn Belt. Available Water Capacity (AWC) quantifies the critical reservoir of plant-usable water, directly buffering against rainfall deficits. It measures the water a soil can store between field capacity, after gravitational drainage, and the permanent wilting point, where plants cannot extract moisture. High AWC means a larger, more stable water supply for crops, correlating directly with drought resilience and yield stability.
The National Cooperative Soil Survey meticulously characterizes AWC within the SSURGO database. Professionals can query the `co_horiz` table for the `awc_r` field, reporting representative available water capacity per unit depth for individual soil horizons, typically in inches of water per inch of soil. For instance, a coarse sandy loam might exhibit an `awc_r` of 0.08 to 0.12 inches per inch, while a rich silt loam could range from 0.18 to 0.25 inches. These values are then aggregated across the effective rooting depth to calculate total available water stored in the `component.awc_r` field. This provides a direct, field-specific measure of a parcel's inherent drought resilience.
What SSURGO Reveals
For crop insurance actuaries, integrating AWC data directly refines risk models, moving beyond generalized regional averages. A farm with predominantly high-AWC soils presents a measurably lower drought risk profile, potentially justifying differentiated premiums or more favorable coverage limits for lenders. Farmland investors can utilize AWC maps to identify properties with inherent resilience, distinguishing prime assets from those more susceptible to yield instability. This data supports strong due diligence, informing valuation adjustments and strategic acquisition decisions. Water rights analysts, too, gain clarity on a parcel's natural water demand, key for assessing resource sustainability.
Precision in AWC mapping is significantly enhanced by incorporating high-resolution terrain data. LiDAR terrain derivatives predict soil series with 70-85% accuracy in cross-validation studies. These detailed topographic insights--including curvature, slope position, and Topographic Wetness Index--reveal subtle variations in soil development, drainage, and organic matter content, all critical for AWC. Geomorphon landform classifications from 1-meter LiDAR also identify distinct terrain elements corresponding to predictable soil drainage and organic matter ranges. By analyzing these spatial patterns, we contextualize SSURGO's point data, producing continuous, high-fidelity maps that reveal both broad trends and localized nuances of soil water storage, essential for assessing agricultural risk.
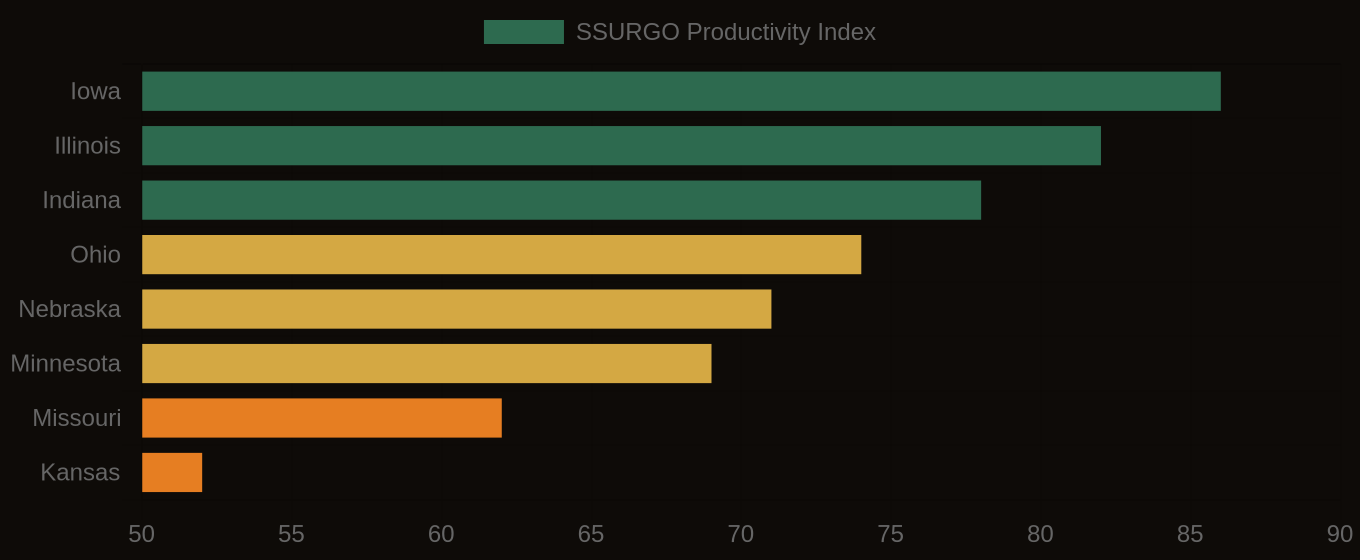
Soil Productivity Index vs. Cash Rent — Corn Belt States
States at Greatest Risk
Understanding and mapping available water capacity offers a profound competitive edge in agricultural finance and risk management. It transforms raw soil data into actionable intelligence, revealing the hidden drought resilience or inherent vulnerability of every parcel. Identifying these subsurface assets allows for smarter underwriting calls, more informed investment strategies, and proactive farm management decisions in an era of increasing climate variability.
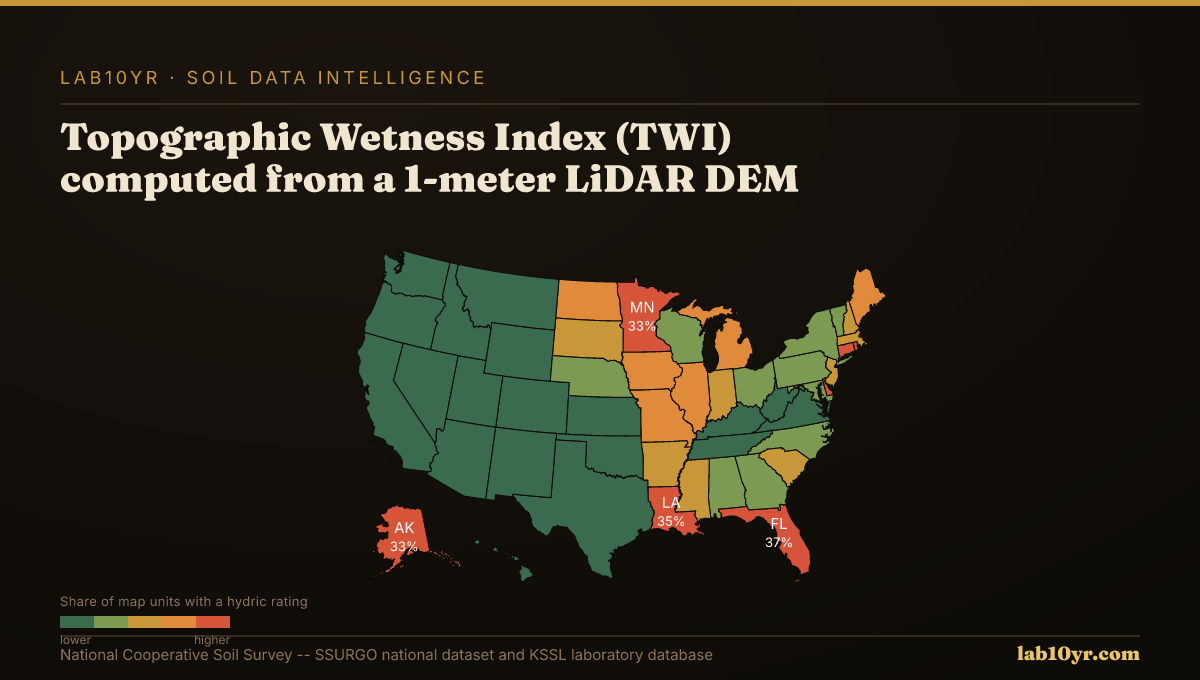
Soil Productivity Index — Farmland Investment Map