In Loudoun County, Virginia, the densest concentration of data centers on Earth sits on ground that the national soil survey rates, politely, as a problem. Run every mapped soil unit in the county through a data-center siting model and only 39 percent of it comes back as buildable. The single largest category is not good and not bad. It is marginal: 3,125 of the county's 8,024 soil map units, more than a third of the ground, land in the middle band where a campus is possible but never cheap.
This is the part of the data-center boom nobody puts in the site-selection deck. Power gets a column. Water gets a column. Fiber and tax abatements get columns. The dirt, the thing that actually has to hold a quarter-million-square-foot slab and a yard full of buried copper, gets a geotechnical bore after the option is already signed. It does not have to work that way. The information has been public for decades.
What the Data Shows
What the survey already knows. The national soil survey records, for nearly every acre in the country, the properties that decide whether ground is cheap or expensive to build on: how far down the seasonal water table sits, how much the clay swells and shrinks with the seasons, how fast buried steel and concrete corrode, how deep you can dig before you hit rock, whether the soil is flood-prone, ponded, or wet enough to count as a regulated wetland. Each of those is a line item on a construction budget. Together they tell you, before a single boring, whether a parcel fights you.
The trouble is that this lives behind a query language and terms of art. So we built a single fuzzy-logic score on top of it, the same way the survey builds its own engineering interpretations: every property is run through a membership curve that turns a raw number into a limitation between zero and one, the engineering ratings for buildings, roads, and excavations are folded in, and the whole thing resolves to one comprehensive index from 0 to 100. We call it GroundScore, and for a data center it is the soil core of the GroundScore DC Index, the model that fuses GroundScore with grid, water, fiber, and land.
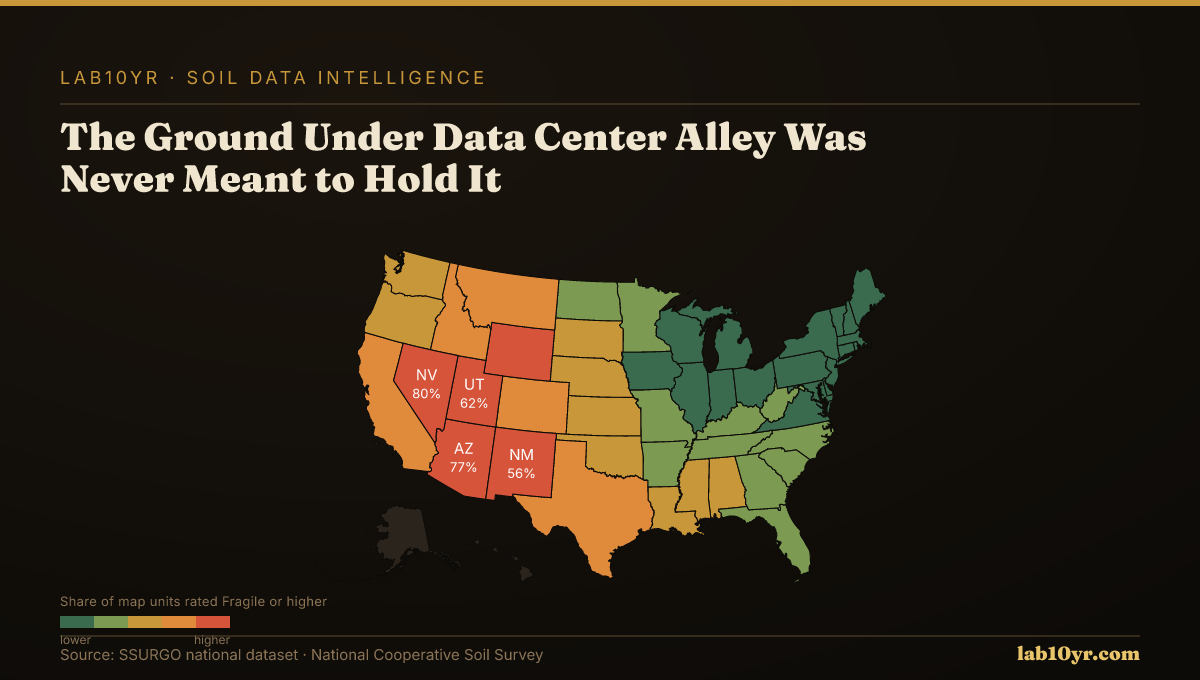
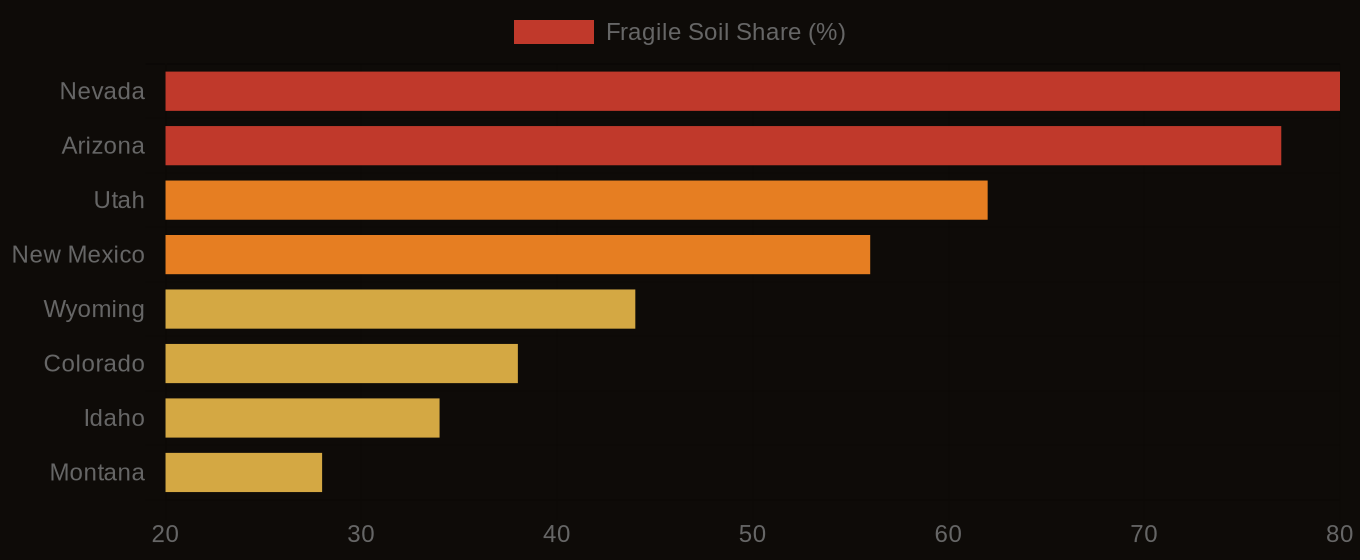
Fragile Soil Index - State Rankings
| State / Region | Fragile or Higher FSI (%) |
|---|---|
| Nevada | 80% |
| Arizona | 77% |
| Utah | 62% |
| New Mexico | 56% |
| Wyoming | 44% |
| Colorado | 38% |
| Idaho | 34% |
| Montana | 28% |
The Regional Picture
Loudoun's signature soil scores a 22. Take Dulles silt loam, one of the soils that underlies a meaningful share of Data Center Alley. GroundScore returns a 21.9 out of 100 for it, classed Poor, and it lists exactly why: a seasonal water table at 38 centimeters, high shrink-swell clay, a hydric wetland signature, and soil that is highly corrosive to steel. None of that makes the ground unusable. It makes it expensive. It means mass grading, engineered fill, under-slab drainage, cathodic protection on the buried steel, and a careful look from a wetland consultant before anything moves. The industry has been quietly paying that bill for fifteen years. It simply never named it.
Contrast a site west of Phoenix, in the Buckeye corridor where hyperscale is now expanding fast. The dominant soil there, Cipriano very gravelly loam, earns a GroundScore of 88.4, Prime: deep, well drained, low shrink-swell, no water table to fight, with only moderate steel corrosion to manage. Same building, a fraction of the ground risk.
Fragile Soil Index Across America
What It Means in Practice
The national picture is not where you would guess. Run the model across whole states and the ranking does not follow the headlines. Of the states analyzed so far, Nebraska at 62 percent buildable and Georgia at 61 percent offer the most forgiving ground. Arizona comes in at 51 percent and Texas at 47 percent, though Texas is bimodal: huge stretches of prime ground next to huge stretches the model excludes outright for flooding and shrink-swell. The wet, clay-rich soils of Ohio at 29 percent and the valley floors of Oregon at 27 percent sit at the bottom.
Virginia, the capital of the industry, lands at 39 percent, kept off the bottom mostly by that enormous marginal middle. The map of where data centers actually clustered and the map of where the ground is easy are not the same map. They were drawn by power and fiber and politics, and the soil was left to the contractors to sort out later.
Why this is about to matter more. The bigger the campus, the more the dirt costs. AI training halls are heavier, denser, and more schedule-sensitive than the cloud build-outs that came before, and they are landing in second and third choice geographies as the first-choice grids fill up. Those are exactly the places where soil risk is least understood and most likely to surprise a pro forma. A site that pencils on power and water can still lose six months and eight figures to ground that needs to be removed, replaced, dewatered, and protected.
The soil data to screen for that has existed, free and public, the entire time. The only thing missing was someone willing to read it before the option closed, instead of after the foundation cracked.