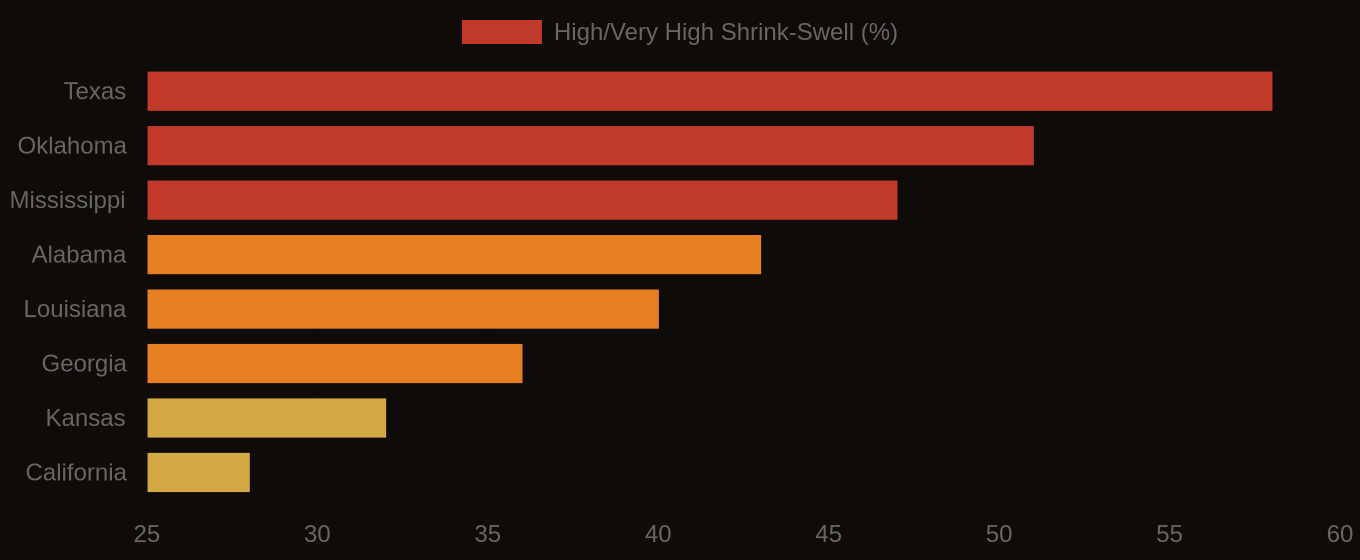
Shrink-swell soils cause more structural damage annually than floods in many U.S. counties, a hazard often ignored by catastrophe models. Yet, a more insidious ground instability, organic soil subsidence, presents an equally significant, unquantified financial exposure. This gradual sinking, driven by unique Histosol properties, impacts infrastructure across 28 million acres of critical U.S. soils mapped by SSURGO.
Organic soil subsidence is an irreversible land elevation reduction. Histosols, formed from accumulated organic matter under waterlogged conditions, are vulnerable. When drained, oxygen initiates aerobic oxidation; microbes decompose organic matter, releasing CO2 and reducing soil volume. Water removal also reduces buoyant support, leading to physical compaction. This rate is characterized via `osd_subsidence_rate` in `coobj_osd`, derived from organic matter and KSSL laboratory bulk density.
What SSURGO Reveals
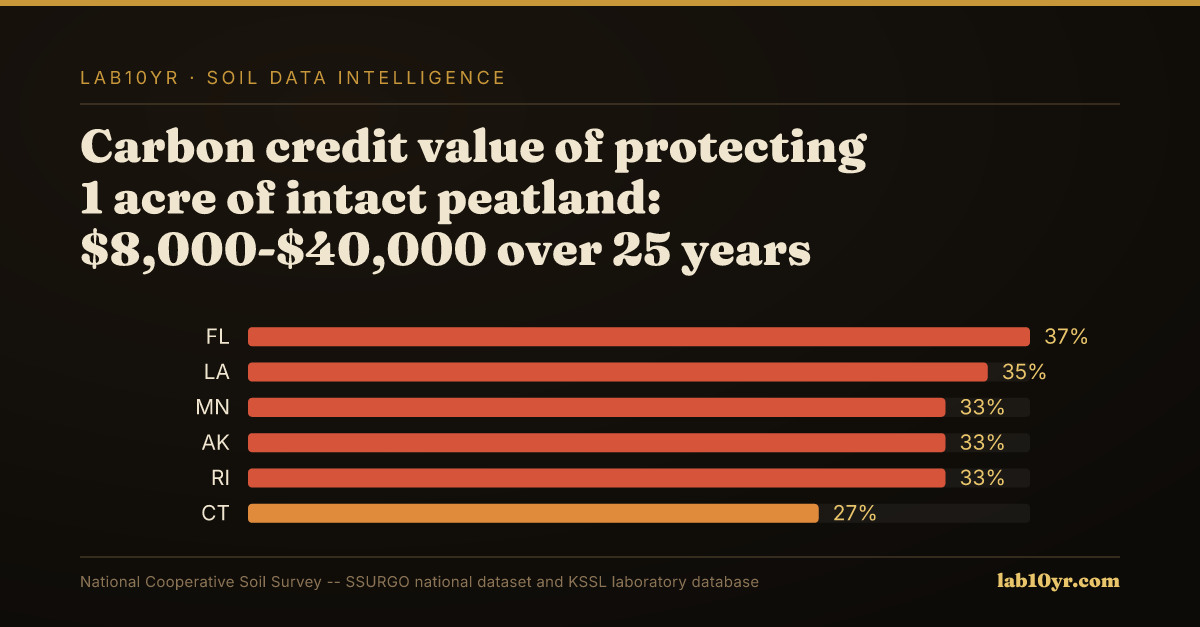
Regions with historical wetland drainage face high subsidence risks. Minnesota holds 7.2 million acres of Histosols, the largest U.S. concentration, averaging 1.5-2 cm per year subsidence in drained areas, compromising infrastructure. Similar challenges affect Florida's Everglades and California's Sacramento-San Joaquin Delta, stressing levees. Drained peatlands release 20-30 times more CO2 than mineral soils. Protecting an intact acre of peatland carries a carbon credit value of $8,000-$40,000 over 25 years.
Quantifying subsidence risk requires precise soil data. We query SSURGO's `component` for `taxorder = 'Histosols'`. Analyzing `chorizon` for organic horizon depths and KSSL data on `bulk_density_oven_dry` (`kssl_bulk_density_measure`) and `organic_carbon_total` (`kssl_carbon_total_hzn`) enables reliable estimations. Lab10YR synthesizes these layers, joining components via `cokey` and horizons via `chkey`, for granular assessments.
Shrink-Swell Soil Hazard — High & Very High COLE Class by State
| State / Region | High/Very High Shrink-Swell (%) |
|---|---|
| Texas | 58% |
| Oklahoma | 51% |
| Mississippi | 47% |
| Alabama | 43% |
| Louisiana | 40% |
| Georgia | 36% |
| Kansas | 32% |
| California | 28% |
| Missouri | 25% |
| Colorado | 22% |
Where Exposure Is Highest
Organic soil subsidence's long-term, incremental nature masks its financial and environmental cost. Catastrophe models focused on sudden events overlook this slow-motion hazard, creating blind spots in underwriting portfolios. Understanding precise subsidence locations and rates through detailed soil intelligence mitigates future losses, accurately prices risk, and recognizes these unique ecosystems' profound value.
Shrink-Swell Soil Hazard — Structural Damage Exposure