Many Rust Belt cities face a dual challenge: declining populations and aging infrastructure built on some of the nation's most corrosive soils. For demographers tracking urban decline and municipal bond analysts assessing risk, this unseen subsurface threat amplifies the financial strain on communities already struggling. In places like Youngstown, Ohio, and Flint, Michigan, the ground itself subtly accelerates the decay of buried pipes and foundations, often without overt signs until failure.
Soil corrosivity is an interpretation derived from several intrinsic soil characteristics influencing metallic structure degradation. Key factors include soil pH, electrical resistivity, and redox potential. A low pH indicates acidity, which directly attacks metal. High electrical resistivity, conversely, slows corrosion by limiting electron flow; low resistivity allows rapid electrochemical reactions. Redox potential, or reduction-oxidation potential, reflects the soil's aeration status: poorly drained, anaerobic soils with low redox potential can promote sulfate-reducing bacteria, a significant contributor to microbial induced corrosion in buried iron and steel. Soil texture and moisture content also play roles, with fine-textured, persistently moist soils often exhibiting lower resistivity. The National Cooperative Soil Survey characterizes these properties within the SSURGO dataset, with pH found in the `chorizon` table and estimated electrical resistivity often available in the `corrosion` table, among others, typically reported in ohm-cm.
State by State
This subterranean hazard carries direct economic consequences. Buried utility lines--water mains, gas pipelines, communication conduits--are vulnerable. Corrosive soils necessitate more frequent repairs, higher maintenance budgets, and accelerated replacement cycles, imposing unforeseen costs on municipalities and private utilities. For municipal bond analysts, high corrosivity ratings translate into elevated infrastructure spending liabilities, potentially impacting credit ratings and borrowing costs. Real estate developers and insurers face increased risks of foundation deterioration, utility service disruptions, and higher construction costs for protective coatings or cathodic protection systems. These hidden costs exacerbate financial pressures on cities already losing residents, creating a feedback loop where decaying infrastructure deters investment.
Understanding and mitigating this risk begins with data. The SSURGO national dataset, encompassing 315,543 map units, provides a foundational layer for assessing soil corrosivity across the United States. Professionals query Soil Data Access (SDA) to retrieve detailed soil properties, linking map unit keys (`mukey`) to component (`cokey`) and horizon-level (`chkey`) data. While direct corrosivity is a critical SSURGO interpretation, other geospatial data streams offer complementary insights for urban planning. For instance, satellite or drone imagery, while not directly measuring corrosivity, can provide context on surface conditions and land use change over time. Combining direct soil property measurements from SSURGO with broader geospatial analyses offers a complete view of urban subsurface risk.
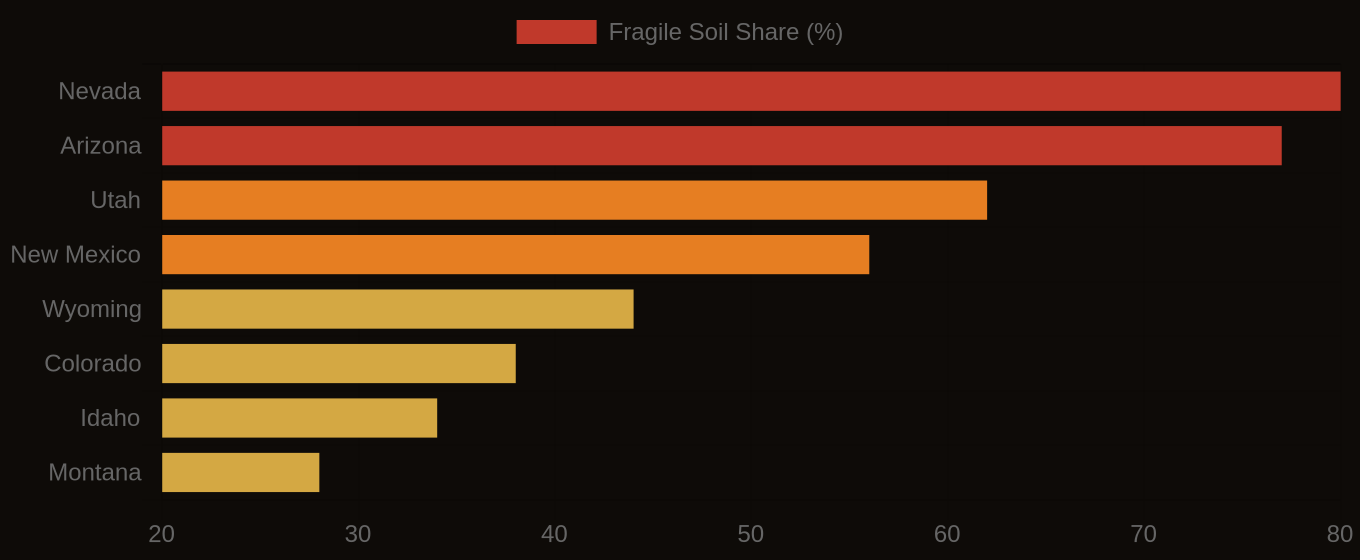
Multi-Hazard Soil Risk — Five Western States Compared
The Data Behind the Map
The soil beneath America's shrinking cities holds a critical, often overlooked, dimension of urban decline. Addressing soil corrosivity, using granular data from the National Cooperative Soil Survey, is not merely an engineering concern; it is fundamental to municipal resilience and urban revitalization.
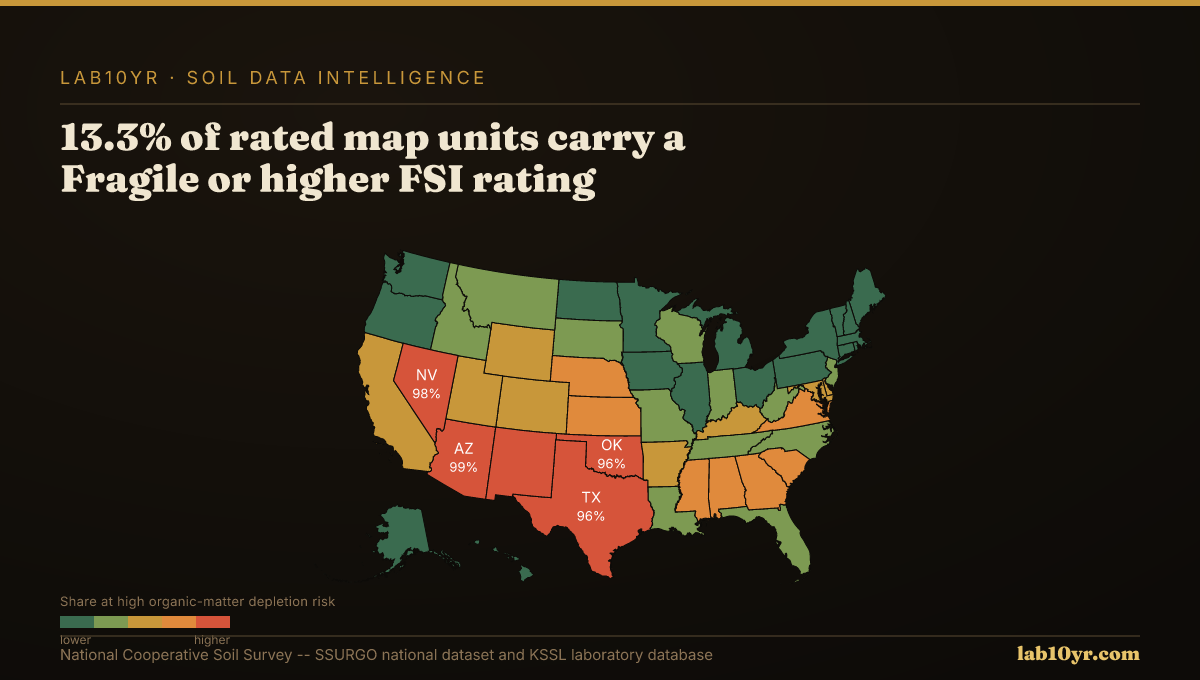
Fragile Soil Index Across America