A Topographic Wetness Index raster built from a 1-meter LiDAR-derived elevation model predicts SSURGO drainage class with about 80 percent accuracy at the map unit level, and it runs in under five minutes on a laptop. That matters because most drainage assessments still rest on hand-drawn soil polygons digitized from aerial photographs that predate LiDAR by four decades.
The index, written TWI, is the natural log of upslope contributing area divided by the tangent of local slope, or ln(a / tan B). The contributing area term, a, is computed by flow accumulation: an algorithm routes water downhill across every cell of the elevation model and tallies how many cells drain through each point. The slope term, tan B, captures how quickly that accumulated water can leave. High values mean a large catchment draining into a flat spot, which is exactly where water collects and the water table sits near the surface. Low values mark steep, shedding side slopes that stay dry.
What the Data Shows
That geometry is the same physical condition that produces hydric soil morphology. When a soil saturates long enough each year, iron and manganese reduce and migrate, leaving the gray and mottled redoximorphic features and accumulated organic matter that define a hydric classification. Those features persist in the profile even after a site is drained, which is why morphology, not present-day water, anchors the rating. TWI predicts where the morphology should be, and SSURGO records where field crews found it.
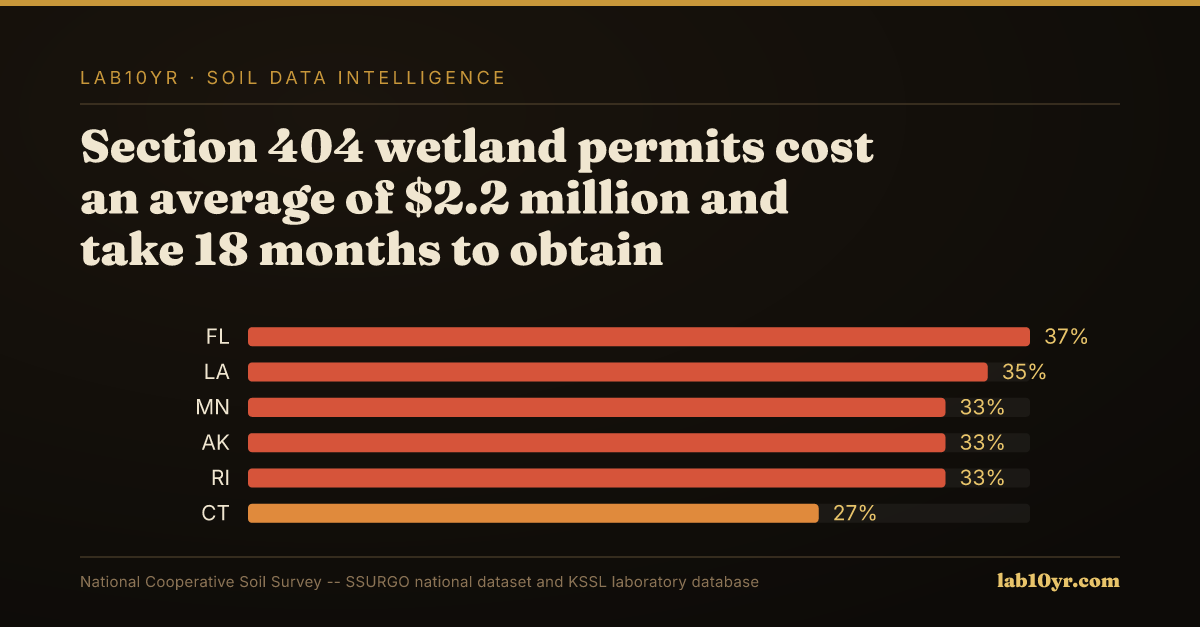
For a precision agriculture manager mapping subsurface drainage tile, a wetland regulator triaging a Section 404 footprint, or a GIS analyst prioritizing delineation, TWI is the cheapest first filter available. Query the hydric rating in the SSURGO component table through the National Cooperative Soil Survey (SSURGO), then overlay it on your own TWI raster; lab10yr.com already shows hydric percentage by map unit so you can calibrate the terrain model against mapped morphology.
Terrain Derivative Accuracy - Predicting SSURGO Drainage Class
| State / Region | Accuracy (%) |
|---|---|
| Random Forest (all derivatives) | 83% |
| Topographic Wetness Index | 79% |
| Geomorphon + TWI | 76% |
| Slope Position Index | 68% |
| Profile Curvature | 62% |
| Slope Angle Only | 44% |
| Legacy SSURGO Polygon | 71% |
The Regional Picture
The terrain told you where water goes long before a surveyor walked the line. TWI just reads the message the topography has been holding all along.
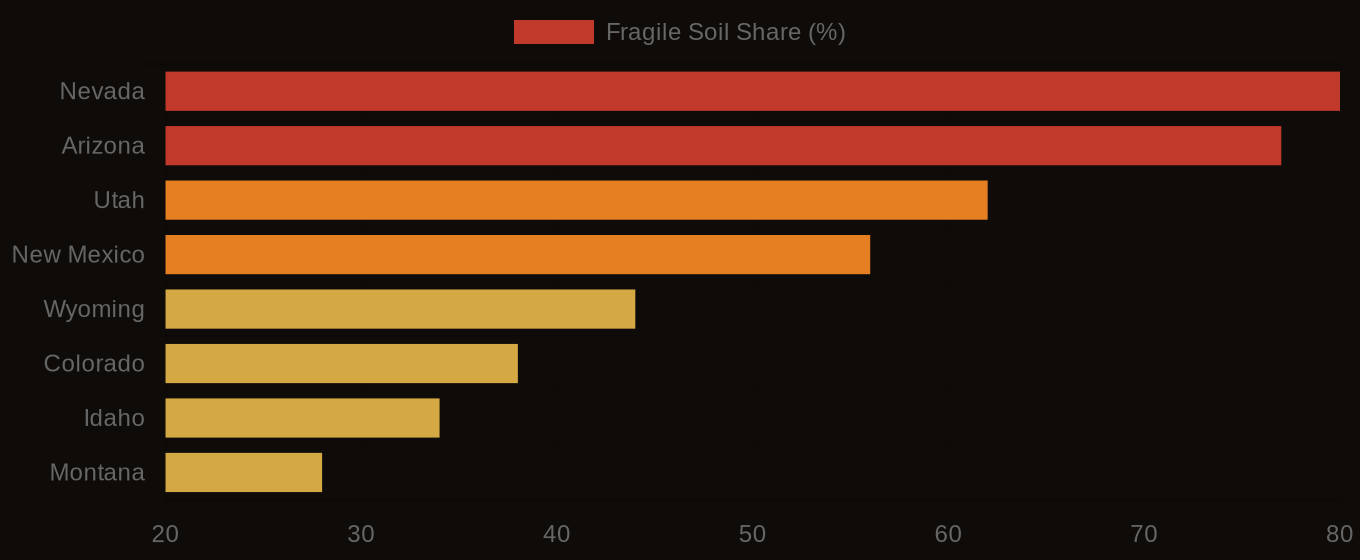
Fragile Soil Index Across America