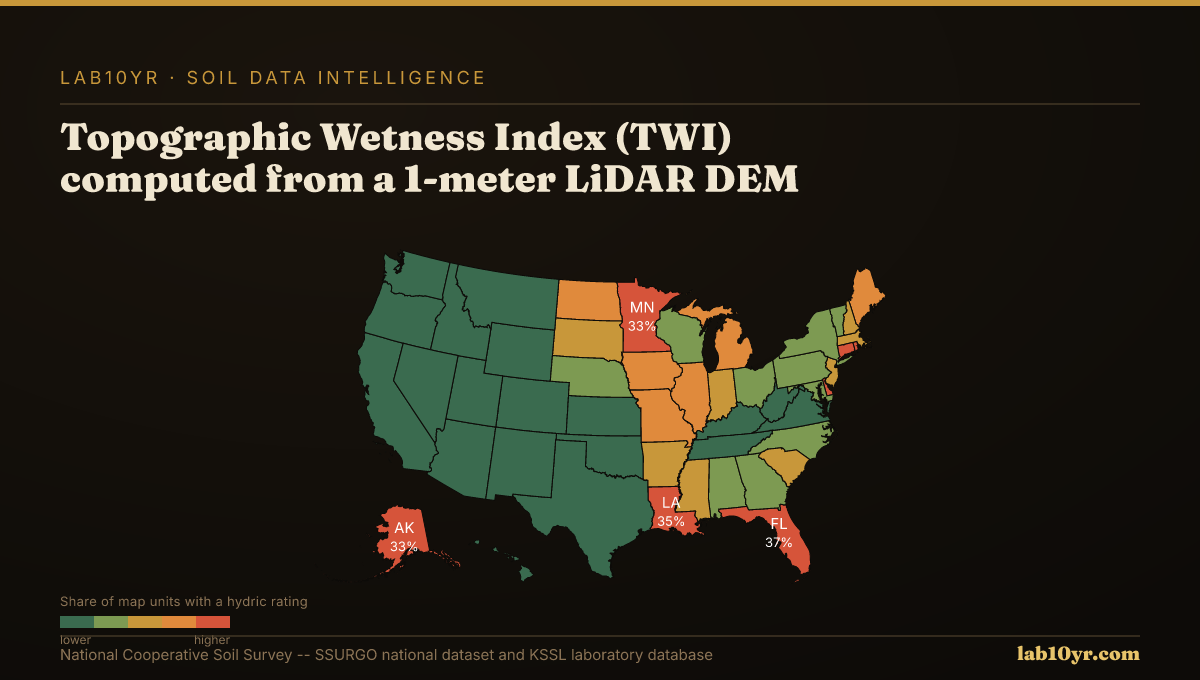
The Topographic Wetness Index, computed from a 1-meter LiDAR Digital Elevation Model, predicts SSURGO drainage class with 78-84% accuracy, a significant improvement over traditional methods. Most drainage assessments still rely on hand-drawn soil polygons that predate modern LiDAR by decades, often missing key microtopographic variations that dictate water movement. This terrain derivative offers a potent tool for rapid, precise assessment, directly impacting land management and infrastructure planning.
The Topographic Wetness Index (TWI) quantifies the potential for water accumulation at any given point on a landscape. It is calculated as the natural logarithm of the ratio of upslope contributing area to the tangent of the local slope (ln(A/tanB)). A larger upslope contributing area (A) means more water potentially flows into that point, while a shallower local slope (B) allows water to pool. High TWI values indicate areas where water is likely to accumulate, leading to saturated soil conditions, reduced oxygen, and the formation of redoximorphic features. These conditions are the hallmark of poorly drained or very poorly drained soils, as classified by the National Cooperative Soil Survey in the SSURGO component table's co_drainagecls field. Conversely, low TWI values indicate well-drained areas where water sheds quickly.
What the Data Shows
This geospatial insight is particularly valuable in flat or subtly undulating landscapes, where small elevation differences can have profound effects on hydrology. In regions like the glaciated plains of the Midwest or the coastal flatwoods of the Southeast, TWI can reveal hydrologic patterns invisible to coarser elevation data. We see that LiDAR terrain derivatives predict soil series with 70-85% accuracy in cross-validation studies, demonstrating the power of detailed topography in understanding soil distribution.
For agricultural lenders, accurately identifying poorly drained areas can prevent misjudging yield potential, which directly affects loan risk and collateral valuation. A misclassification in a single 40-acre field can represent tens of thousands of dollars in lost crop productivity over a growing season. For civil engineers, precise drainage mapping avoids costly foundation failures or pipeline corrosion exacerbated by prolonged saturation. In wetlands delineation, TWI provides quantitative evidence to support or challenge boundaries, streamlining permitting and reducing project delays.
Terrain Derivative Accuracy — Predicting SSURGO Drainage Class
| State / Region | Accuracy (%) |
|---|---|
| Random Forest (all derivatives) | 83% |
| Topographic Wetness Index | 79% |
| Geomorphon + TWI | 76% |
| Slope Position Index | 68% |
| Profile Curvature | 62% |
| Slope Angle Only | 44% |
| Legacy SSURGO Polygon | 71% |
The Regional Picture
Lab10YR integrates high-resolution LiDAR DEMs to compute TWI and other terrain derivatives, validating these against National Cooperative Soil Survey data. We use the SSURGO component table, specifically the co_drainagecls field, to establish the empirical relationship between terrain morphology and observed drainage. This allows us to deliver granular, data-driven assessments that refine traditional soil surveys.
By adopting TWI and other LiDAR-derived metrics, professionals can move beyond generalized soil maps to a granular understanding of water dynamics on the land. This shift provides a scientific foundation for more resilient infrastructure, more productive agriculture, and more accurate environmental assessments, reducing financial risk across diverse industries.
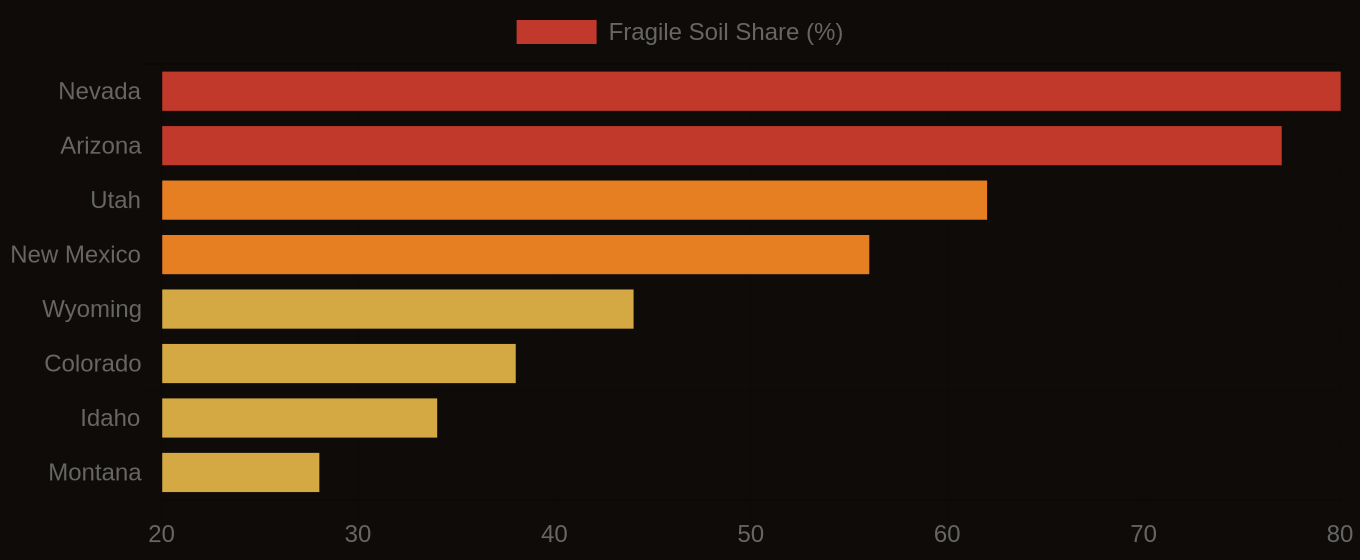
Fragile Soil Index Across America