Sub-centimeter topographic changes, previously requiring costly ground-based surveys, are now detectable with routine unmanned aerial vehicle (UAV) photogrammetry missions. This capability offers mine reclamation engineers and wildfire recovery planners significant cost savings, replacing $50,000 ground-based survey campaigns with more frequent, detailed observations, transforming post-disturbance monitoring. It allows for precise quantification of soil movement, a critical metric for assessing environmental recovery and infrastructure stability.
Structure-from-Motion (SfM) photogrammetry is the underlying mechanism. This technique uses hundreds of overlapping digital images captured by a UAV to construct dense 3D point clouds of the earth's surface. By comparing these highly detailed digital surface models (DSMs) from sequential flights, precise volumetric changes, down to a few millimeters, can be quantified. This directly measures soil loss or deposition, which is essential for evaluating the effectiveness of stabilization efforts on disturbed lands and predicting future erosion potential.
What the Data Shows
While UAVs capture the surface geometry, interpreting its implications requires sound soil data. For instance, multispectral drone imagery at 5-cm resolution predicts soil organic matter with R-squared 0.82-0.87 from bare soil composites, offering insight into surface stability and revegetation potential. The Kellogg Soil Survey Laboratory (KSSL) spectral library, containing Vis-NIR-SWIR scans of 50,000+ soil samples with matched laboratory chemistry measurements, provides essential calibration data for these analyses, ensuring accurate interpretation of spectral signals. Bare soil Vis-NIR-SWIR reflectance predicts soil organic carbon with R-squared 0.75-0.88 in the Corn Belt, further demonstrating the spectral link to a key soil quality indicator. Even when clouds obscure visible light, Sentinel-1 SAR backscatter detects surface soil moisture at 10-meter resolution under cloud cover and at night, providing essential context for erosion risk by indicating volumetric water content in the top 5 cm. This integrates with SSURGO available water capacity data for a fuller picture of soil hydrologic response.
For construction project managers, quantifying erosion at a granular level identifies areas needing immediate stabilization before larger failures occur, preventing costly remediation of unexpected washouts. Environmental consultants use this data to verify compliance with reclamation bond release criteria, demonstrating effective site restoration through measured soil stability and documented soil property improvements. This combination of high-resolution topographic change detection and detailed soil properties from the National Cooperative Soil Survey allows for precise risk modeling.
Soil Carbon Prediction Accuracy — Spectral vs. Traditional Methods
| State / Region | R² — SOC Prediction |
|---|---|
| UAV Multispectral (5cm) | 0.87% |
| Vis-NIR-SWIR Lab Scan | 0.84% |
| Sentinel-2 Bare Soil | 0.71% |
| Landsat Composite | 0.63% |
| Field Morphology | 0.55% |
| Grid Sampling | 0.48% |
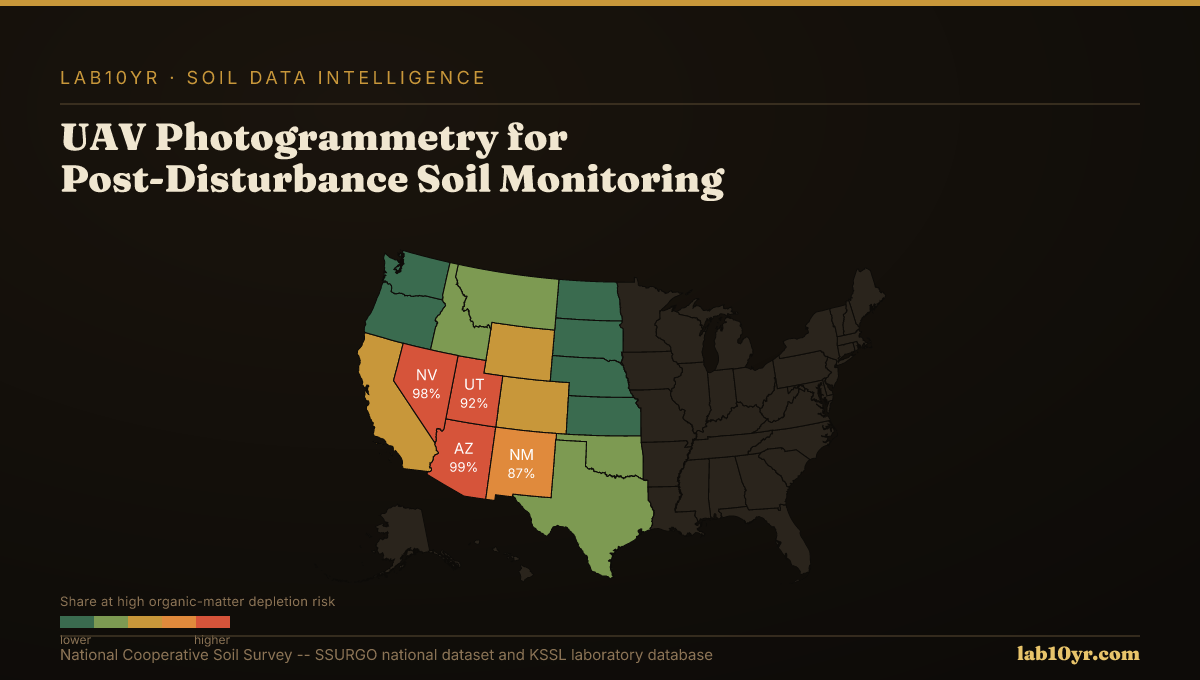
The Regional Picture
At Lab10YR, we integrate these high-resolution surface models with the vast archive of SSURGO data. We interpret measured surface changes in the context of underlying soil series properties, such as erodibility factors (Kf) from the `component` table or hydraulic conductivity from `chorizon`. This layered data approach offers a detailed understanding of disturbance impacts, informing targeted interventions and long-term land management strategies.
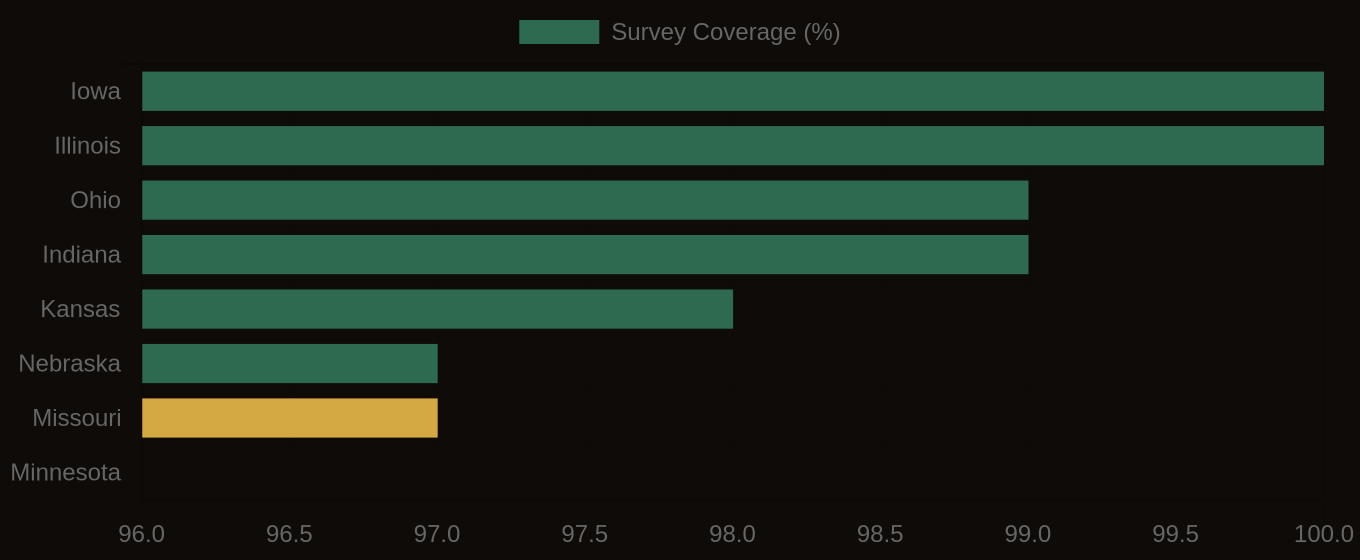
SSURGO Data Coverage — National Survey Completeness