Surface temperature maps show the symptom. Soil data reveals the mechanism. Urban heat islands, often perceived as a challenge of dark roofs and vast asphalt, begin their thermal retention cycle deep underground, driven by the inherent thermal properties of the soil beneath our cities. For urban planners and municipal engineers, understanding this subsurface dynamic is essential for designing effective climate resilience strategies and mitigating the escalating costs of heat-related infrastructure damage.
Soil thermal conductivity, the ability of soil to transfer heat, is a critical, often overlooked, factor. It dictates how quickly heat absorbed by impervious surfaces moves into the ground below and how slowly it dissipates. Denser soils, or those with higher moisture content, conduct heat more efficiently than porous, dry soils. Similarly, soil specific heat capacity determines how much heat a given volume of soil can store. These properties are directly influenced by soil bulk density, water content, and organic matter. For instance, the heavily compacted, clay-rich urban soils in a city like Dallas will behave very differently from the sandy soils of a coastal plain, becoming significant heat sinks due to their altered thermal conductivity and capacity. The National Cooperative Soil Survey's SSURGO database provides complete data on these foundational properties, including `ch.dbthirdbar_r` for bulk density, `ch.awc_r` for available water capacity, and `ch.om_r` for organic matter content.
State by State
When natural soils are capped by pavement and concrete, the entire thermal regime shifts dramatically. Impervious surfaces, with their low albedo, absorb vast amounts of solar radiation, transferring a significant portion of that energy to the underlying soil. We interpret SSURGO data to model the subsurface heat capacity and conductivity, mapping zones of thermal vulnerability. The Kellogg Soil Survey Laboratory's spectral library, containing Vis-NIR-SWIR scans of 50,000+ soil samples with matched laboratory chemistry measurements, provides a foundational reference for understanding how spectral signatures correlate with critical soil properties that influence thermal behavior. Moreover, while Sentinel-1 SAR backscatter detects surface soil moisture at 10-meter resolution under cloud cover and at night, this critical surface moisture data gains interpretative power when integrated with SSURGO's deeper available water capacity information. C-band SAR's sensitivity to volumetric water content in the top 5 cm directly informs the ground's immediate thermal response, revealing where saturated soils act as more efficient heat sinks or sources.
For municipal authorities, this subsurface understanding is not merely academic; it is a design imperative for cooler, more resilient cities. Without accounting for soil thermal properties, initiatives like urban greening or cool pavement programs may address symptoms without resolving the underlying thermal storage issues. Lab10YR analyzes 315,543 map units in the SSURGO national dataset, providing detailed interpretations of soil properties that directly inform thermal performance. We identify zones where existing soil characteristics, exacerbated by development, contribute most significantly to heat retention, guiding targeted interventions. Our interpretations provide the foundational soil intelligence needed to design cooling strategies that truly work from the ground up, impacting everything from infrastructure design to public health outcomes. We map the unseen thermal reservoirs that dictate a city's resilience.
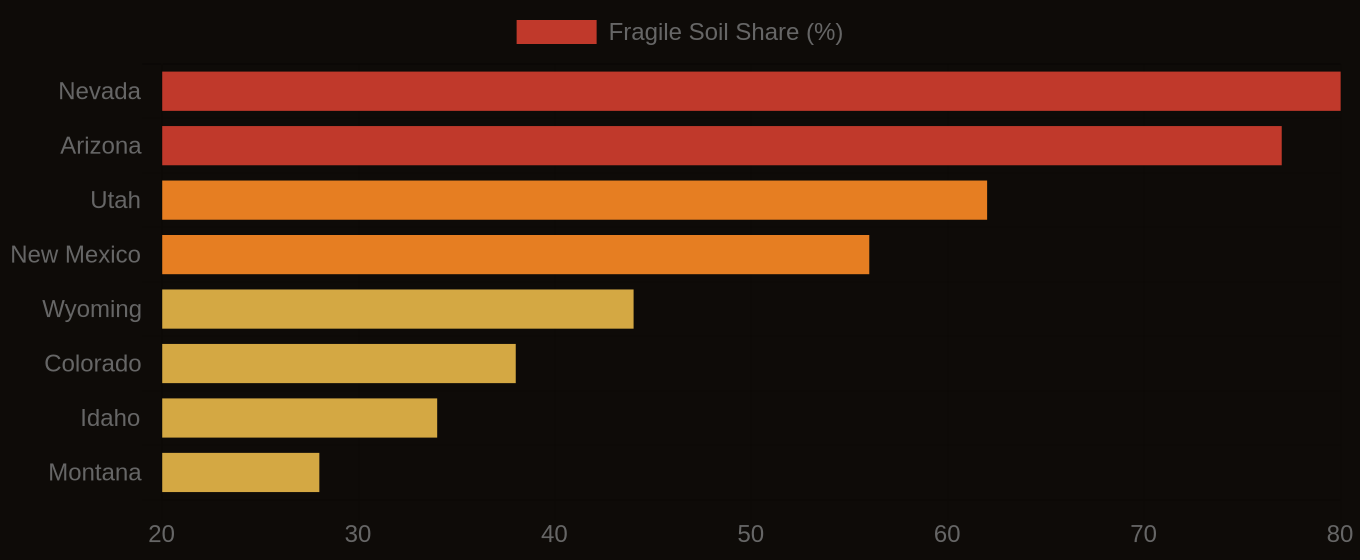
Multi-Hazard Soil Risk — Five Western States Compared
The Data Behind the Map
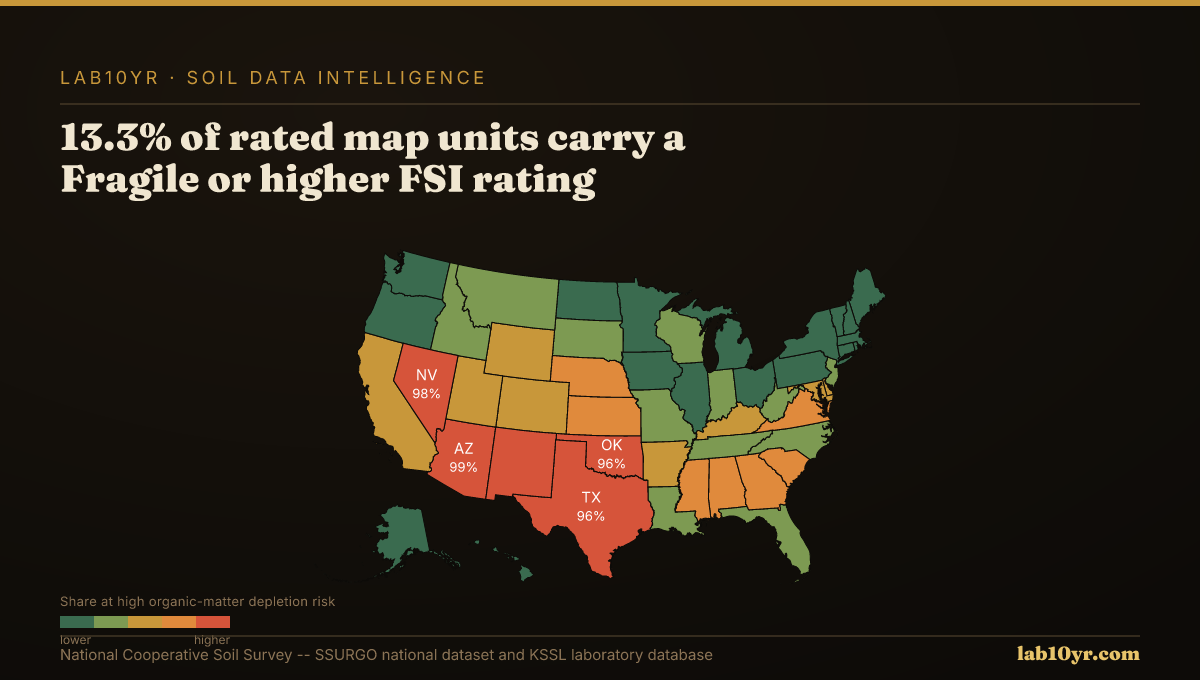
Fragile Soil Index Across America