Sentinel-1, the European radar satellite that maps the ground every twelve days, is now resolving vertical motion across American cities at a precision of a few millimeters per year. When analysts cross-reference those moving pixels against the soil maps that have existed for decades, a pattern keeps repeating. In the majority of documented subsidence events, the soil component beneath the deforming surface was already rated for high settlement potential in SSURGO, the digital soil survey assembled by the National Cooperative Soil Survey. The satellite is confirming, with expensive orbital hardware, what a free database had flagged at the map unit level long before launch.
This is not a coincidence of correlation. It is the same physics observed at two scales. Interferometric synthetic aperture radar, abbreviated InSAR, works by comparing the phase of radar echoes from two passes over the same ground. Sentinel-1 transmits a C-band pulse with a wavelength near 5.6 centimeters. If the ground moves toward or away from the sensor between passes, the returning wave arrives slightly out of step with the earlier one, and that phase shift converts directly into line-of-sight displacement. Stack dozens of acquisitions over a year, filter the atmospheric noise, and the technique resolves settlement of two to three millimeters annually over a stable reflector such as a building roof or a pipeline marker. The satellite measures the symptom. It cannot see why the ground is sinking.
What the Data Shows
The why lives in the soil profile, and SSURGO records it. Settlement is the vertical strain a soil undergoes when load or drainage changes the balance of forces among its particles. Two mechanisms dominate. The first is consolidation, the slow expulsion of water from the pore spaces of a saturated fine-grained soil as a load presses down, allowing the grains to pack closer together. The second, which governs the most dramatic urban subsidence, is the oxidation and compression of organic matter. When a soil rich in partially decayed plant tissue is drained, oxygen reaches carbon that had been preserved underwater for millennia, and microbes convert it to carbon dioxide. The solid framework of the soil literally burns away into the air, and the surface drops.
Both mechanisms leave fingerprints that soil scientists read in a pit wall, and those fingerprints are why hydric ratings predict deformation so reliably. A hydric soil is one that formed under saturation long enough to develop the morphology of an oxygen-starved environment. Field scientists identify it by redoximorphic features, the rust-colored mottles and gray depletions that mark where iron has dissolved and re-precipitated as water rose and fell, and by the dark accumulation of organic carbon near the surface. These features persist after a site is drained, ditched, or filled. The soil remembers its wet origin in its color and structure for centuries, which is precisely why a hydric rating assigned from a decades-old soil survey still tells an engineer where compressible, oxidizing, settlement-prone material lies underground today.
Soil Carbon Prediction Accuracy - Spectral vs. Traditional Methods
| State / Region | R² - SOC Prediction |
|---|---|
| UAV Multispectral (5cm) | 0.87% |
| Vis-NIR-SWIR Lab Scan | 0.84% |
| Sentinel-2 Bare Soil | 0.71% |
| Landsat Composite | 0.63% |
| Field Morphology | 0.55% |
| Grid Sampling | 0.48% |
The Regional Picture
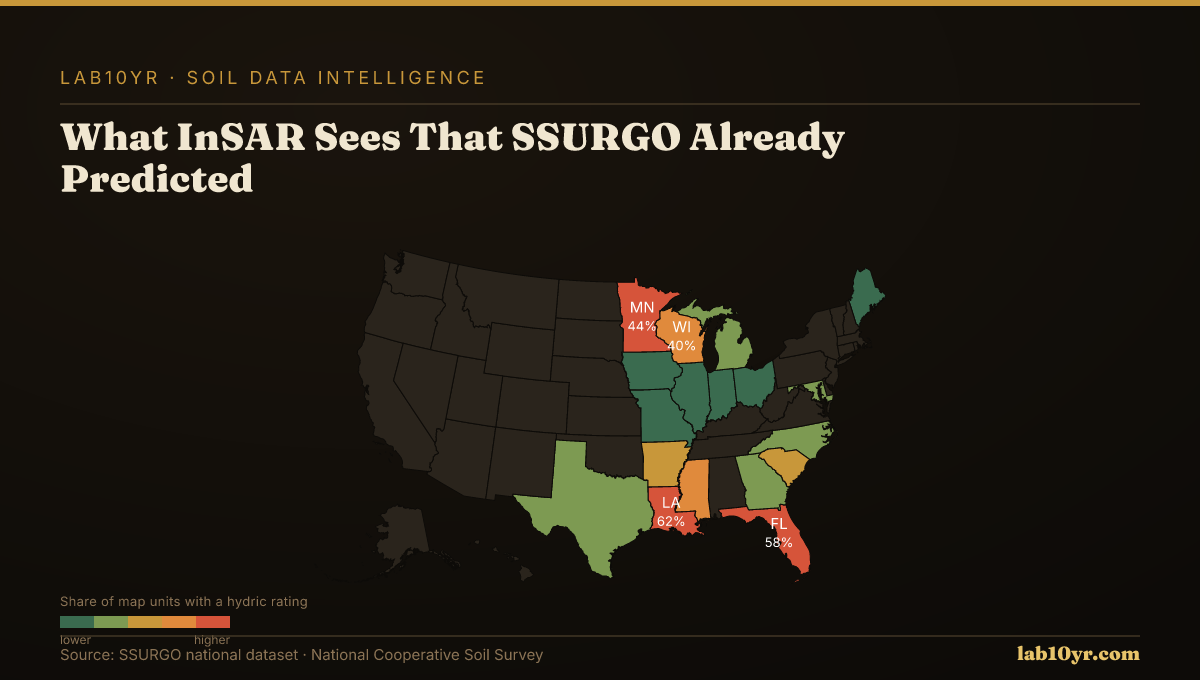
The national numbers explain why this matters across so much infrastructure. Roughly 31 percent of all mapped SSURGO soil components carry a hydric classification, and the contiguous United States contains about 109 million acres of hydric soils. That is the footprint of ground that began life saturated and that, where it has been drained for development or agriculture, is prone to the consolidation and organic oxidation that InSAR now watches in real time. Not every hydric acre is sinking, and not every hydric soil is an organic peat. But the overlap between the hydric layer in SSURGO and the deforming pixels in a Sentinel-1 stack is strong enough that a hydric screen functions as a first-pass subsidence forecast.
The regional pattern follows the geology of saturation. Florida is the clearest case, with 28 percent of its land area mapped as hydric soils, the highest share in the continental United States. The state's flat topography holds water near the surface, and three groups of soils dominate the result: Flatwoods soils with their shallow water tables, Spodosols with cemented subsurface horizons that perch water, and Histosols, the true organic soils built of accumulated peat and muck. Histosols are the ones that subside by feet rather than inches. Drain a Florida muck for farming or building, and the surface can drop a centimeter or more every year for decades as the organic column oxidizes. InSAR sees that as a steady, unmistakable signal. SSURGO saw it as a soil order on a map.
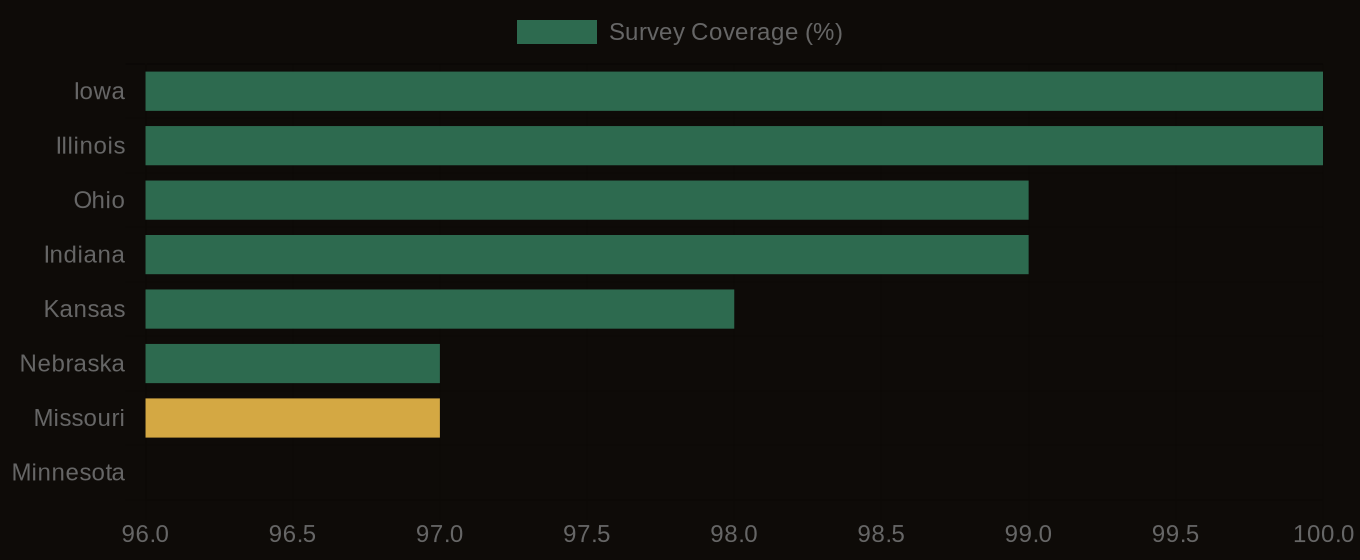
SSURGO Data Coverage - National Survey Completeness
What It Means in Practice
For the people who build and operate on this ground, the gap between a free rating and a satellite observation is measured in dollars and failure modes. A pipeline operator whose right of way crosses a drained Histosol faces differential settlement, the condition where one segment of a structure sinks faster than its neighbor. A buried steel line that settles uniformly is fine. A line that settles two centimeters per year over a peat lens and almost nothing over the adjacent sand is bent across that boundary, and the bending stress concentrates at the transition until a weld or coating fails. InSAR is good at catching exactly this geometry, because it produces a continuous field of displacement and the steep gradient at a soil boundary jumps out of the data. SSURGO predicts where that boundary sits before any pipe is in the ground.
Municipal planners confront the same physics under streets and storm drains. A gravity sewer depends on a designed slope of a fraction of a percent. Lay that pipe across a transition from mineral upland to organic lowland, let the organic side consolidate, and the slope reverses into a sag that holds sewage and breeds blockages. Geotechnical consultants know to over-excavate and surcharge organic ground, but the budget for that work is set early, often before borings are drilled, and a hydric screen run at the planning stage tells a designer which alignments will demand the expensive treatment. The same rating that flags a probable wetland flags a probable settlement problem, because the soil property underneath both is the same accumulation of saturated organic matter.
Consider Belle Glade, Florida, on the southern rim of Lake Okeechobee in the Everglades Agricultural Area. The soils there are deep Histosols, drained more than a century ago for sugarcane and vegetables, and their subsidence is among the best-documented in the world. Long before Sentinel-1 existed, ground surveys recorded the muck surface dropping on the order of a centimeter or more per year as the peat oxidized, and benchmark posts set decades ago now stand high above the fields like fence rails left by a receding tide. When InSAR analysts process a radar stack over that district, the deformation field lights up across the organic soils and goes quiet over the mineral margins. The satellite resolves the rate. SSURGO's soil order, mapped from a pit and an auger, resolved the cause and the boundary. An operator running a fuel line, a power corridor, or a water main across that district who consulted the soil survey first would have priced the settlement risk into the route, rather than discovering it in a phase-unwrapped image after the asset was buried.
The economics extend beyond settlement, because the same hydric rating that predicts deformation also predicts regulatory exposure. A Section 404 wetland permit from the Army Corps of Engineers costs an average of 2.2 million dollars and takes about 18 months to obtain, based on permit processing statistics from 2019 through 2023. Formal wetland delineation field work runs 500 to 2,000 dollars per acre for complex sites. A preliminary SSURGO hydric screen, by contrast, takes about thirty seconds and a free data call, and it identifies the sites that will require delineation with roughly 85 to 90 percent accuracy. The hydric soils that subside are frequently the same hydric soils a regulator will treat as probable jurisdictional wetland, which means a single rating informs both the geotechnical schedule and the permitting calendar for the same parcel.
The data is genuinely public, and accessing it does not require buying imagery. SSURGO is distributed through the National Cooperative Soil Survey (SSURGO), an SQL interface maintained by the National Cooperative Soil Survey that lets anyone query the 315,543 map units in the national dataset by location. An engineer can pass a point or a polygon to the API and retrieve the component names, the hydric rating, the depth to water table, the organic matter content of each horizon, and the settlement-relevant engineering properties for that map unit. The hydric flag is a single field. The Fragile Soil Index, which rates a soil's vulnerability to degradation under disturbance and which marks the 13.3 percent of rated units carrying a Fragile or higher score, is another. Pulling those fields for a corridor before design is the cheapest risk reduction available to a project. The lab10yr.com platform already surfaces these layers without the SQL, joining the hydric and Fragile ratings to the soil series at a point so that a planner can see, in one view, where the ground that satellites will later watch for motion sits beneath a proposed alignment.
Radar from orbit is a remarkable instrument, and it deserves its place in the asset manager's toolkit, because nothing else measures real motion across a whole city at once. But the lesson of the overlap is that InSAR is a confirmation technology, not a discovery one. By the time a pixel has moved a measurable distance, the settlement is already underway and the load or the drainage that triggered it is already in place. The soil survey speaks earlier. It describes the material, its origin in saturation, and its propensity to consolidate or oxidize, in time to choose a different route, a deeper foundation, or a surcharge program. The most economical reading of the ground happens before the satellite ever looks, in a database that has been quietly recording the answer for decades.