The Department of Energy has allocated billions for electric vehicle charging infrastructure, yet a critical geotechnical variable, soil bearing capacity, often remains an afterthought in initial site assessments. This oversight introduces substantial risk, translating directly into foundation failures, costly redesigns, and significant project delays. Without understanding the subsurface, infrastructure planners commit to sites that may require millions in unforeseen remedial work or render the charging station functionally compromised.
Soil bearing capacity is the maximum pressure a soil can withstand without experiencing excessive settlement or shear failure. It is not an intrinsic property but an interpretation derived from fundamental engineering characteristics like shear strength, compressibility, and plasticity. For cohesive soils, plasticity is quantified by Atterberg limits -- the liquid limit and plastic limit -- which determine how a soil behaves with varying moisture content. These are precisely measured in the National Cooperative Soil Survey's KSSL laboratories and are available in the `ch_eng` table within Soil Data Access under fields such as `ll` (liquid limit) and `pl` (plastic limit). Granular soil strength, conversely, hinges on particle size distribution and compaction, with bulk density (`dbov_l` in `ch_eng`) serving as a key indicator. SSURGO's `co_const_limitations` table contains interpretations directly relevant to foundation support, offering critical initial insights into site suitability through fields like `found_support_kind`.
What the Data Shows
For instance, sites underlain by expansive clays, common in parts of Texas or the Black Belt region of Alabama, exhibit low bearing capacity and high shrink-swell potential. These soils, characterized by high linear extensibility values (`coecofv` in SSURGO's `co_const_limitations` table), can cause differential settlement that cracks concrete pads and disrupts electrical conduit, leading to service interruptions. Conversely, well-graded sands and gravels, found in glaciofluvial deposits across the Upper Midwest, generally offer excellent bearing capacity, reducing foundation costs.
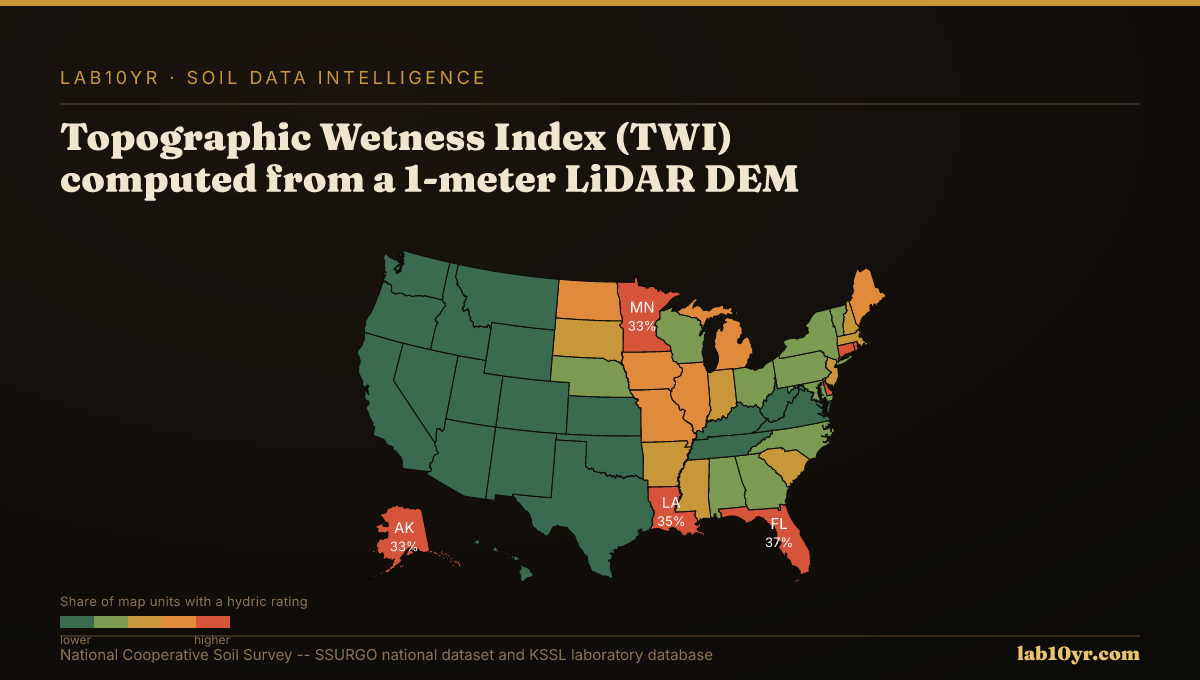
Geospatial analysis offers a powerful lens to identify these variations. LiDAR-derived terrain attributes, such as the Topographic Wetness Index (TWI), predict SSURGO drainage class with 78-84% accuracy. TWI integrates upslope contributing area and local slope, quantifying water accumulation potential -- a direct influence on soil strength. LiDAR terrain derivatives predict soil series with 70-85% accuracy in cross-validation studies. Geomorphon landform classification from 1-meter LiDAR further refines this, identifying ten terrain element types, like footslopes or valleys, that correspond to distinct soil drainage and organic matter conditions. These advanced digital soil mapping techniques, drawing on the 315,543 map units in the SSURGO national dataset, allow us to infer subsurface conditions where direct borings are absent, helping engineers flag unsuitable sites early.
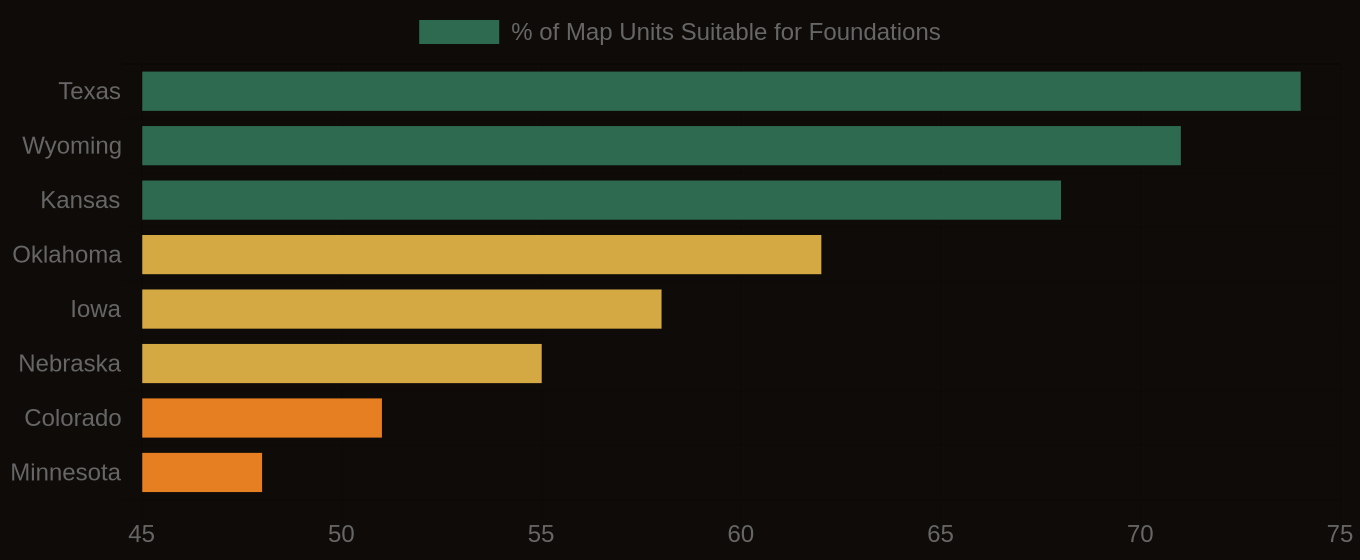
Soil Drainage Suitability — Top Wind & Solar States
| State / Region | Well/Exc. Drained (suitable) | Mod. Well Drained (marginal) | Poorly Drained (unsuitable) |
|---|---|---|---|
| Texas | 74% | 13% | 13% |
| Wyoming | 71% | 14% | 15% |
| Kansas | 68% | 15% | 17% |
| Oklahoma | 62% | 18% | 20% |
| Iowa | 58% | 22% | 20% |
| Nebraska | 55% | 20% | 25% |
| Colorado | 51% | 20% | 29% |
| Minnesota | 48% | 24% | 28% |
Where Exposure Is Highest
Ignoring soil data can be a multi-million dollar mistake. A municipal EV fleet depot planned on highly plastic clays could face an additional $500,000 to $1 million in foundation costs for piers and grade beams, compared to a site on stable glacial till. These costs, born by taxpayers or utility ratepayers, are entirely avoidable with proper due diligence. Lab10YR integrates these SSURGO and KSSL datasets, providing complete subsurface risk assessments for site selection. We interpret the `co_const_limitations` table's `found_support_kind` and `found_support_comment` fields, alongside KSSL engineering properties from the `ch_eng` table, to deliver actionable intelligence for EV charging infrastructure planners.
Soil Foundation Suitability — Wind & Solar Energy States