The whole company, in three stops.
No slides. Everything below is the live product: the open data, the scoring app, and a real report. Follow the stops in order, or jump around. Each one opens the actual tool.
See the data
For over a century, the national soil survey has sent scientists into the field to record what is underfoot, county by county. The result is 967,000 records across 4,089 survey areas, covering every county in the US.
It is one of the largest scientific datasets the public has ever paid for, and almost nobody can read it. We make it readable.
The Soil Atlas turns that archive into a national map with 7 story modes. Open it, pick a mode, and watch the country redraw itself by what is under the surface.
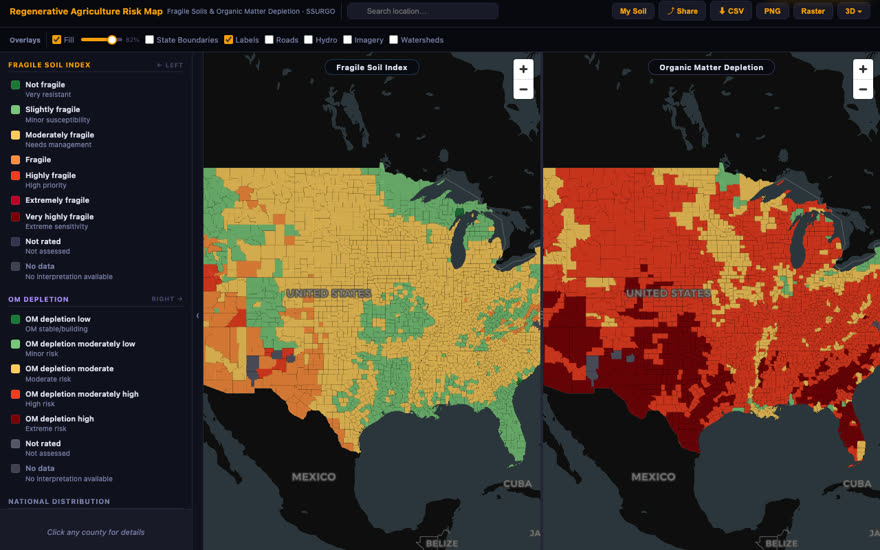
967,000 records, drawn as one national map.

Score a site
Before anyone commits capital to a data center, someone has to answer one question: will the ground hold? GroundScore DCI, our data center siting index, reads the soil survey for any parcel you pick and returns a plain verdict.
One factor stack, reweighted: the same measured soil properties, weighted for what a data center actually stresses. Draw a site, get the verdict, and see exactly which factors drove it.
Get the report
Maps start the conversation. The paid deliverable ends it: a written report on your ground, built and reviewed by licensed pedologists. A pedologist is a scientist whose specialty is soil.
The standard is simple: defensible to a lender, a regulator, or a jury.
Below is a real one, unredacted, so you can judge the work before you buy it. Bring us your hardest ground question.